Engineering Note
Consumer Lag Is Not a Health Score: Thinking in Kafka Consuming Pressure
A practical way to read Kafka Consumer Lag together with producer rate and consumer group capacity instead of treating lag as an absolute health signal.
When you operate Kafka, consumer lag is one of the first metrics you learn to watch. If lag grows, messages are waiting. If messages are waiting, users may see delayed notifications, delayed data updates, or delayed downstream processing.
So it makes sense that many service and platform teams monitor consumer lag closely. That part is right. The problem starts when the metric becomes the whole story.
Consumer lag is important, but can one number decide whether a service is healthy or a system is stable?
My answer is closer to no. Consumer lag is a useful signal, but it is not a complete judgment by itself. Lag is closer to an outcome. What operators usually need to know is this:
Can this consumer group absorb the message pressure it is receiving right now?In this post, I will call that view Consuming Pressure.

The short version
When reading Kafka consumer lag, keep these points together:
- The trend matters more than the absolute lag number.
- Growing lag can be a consumer problem, but it can also be a producer-rate change.
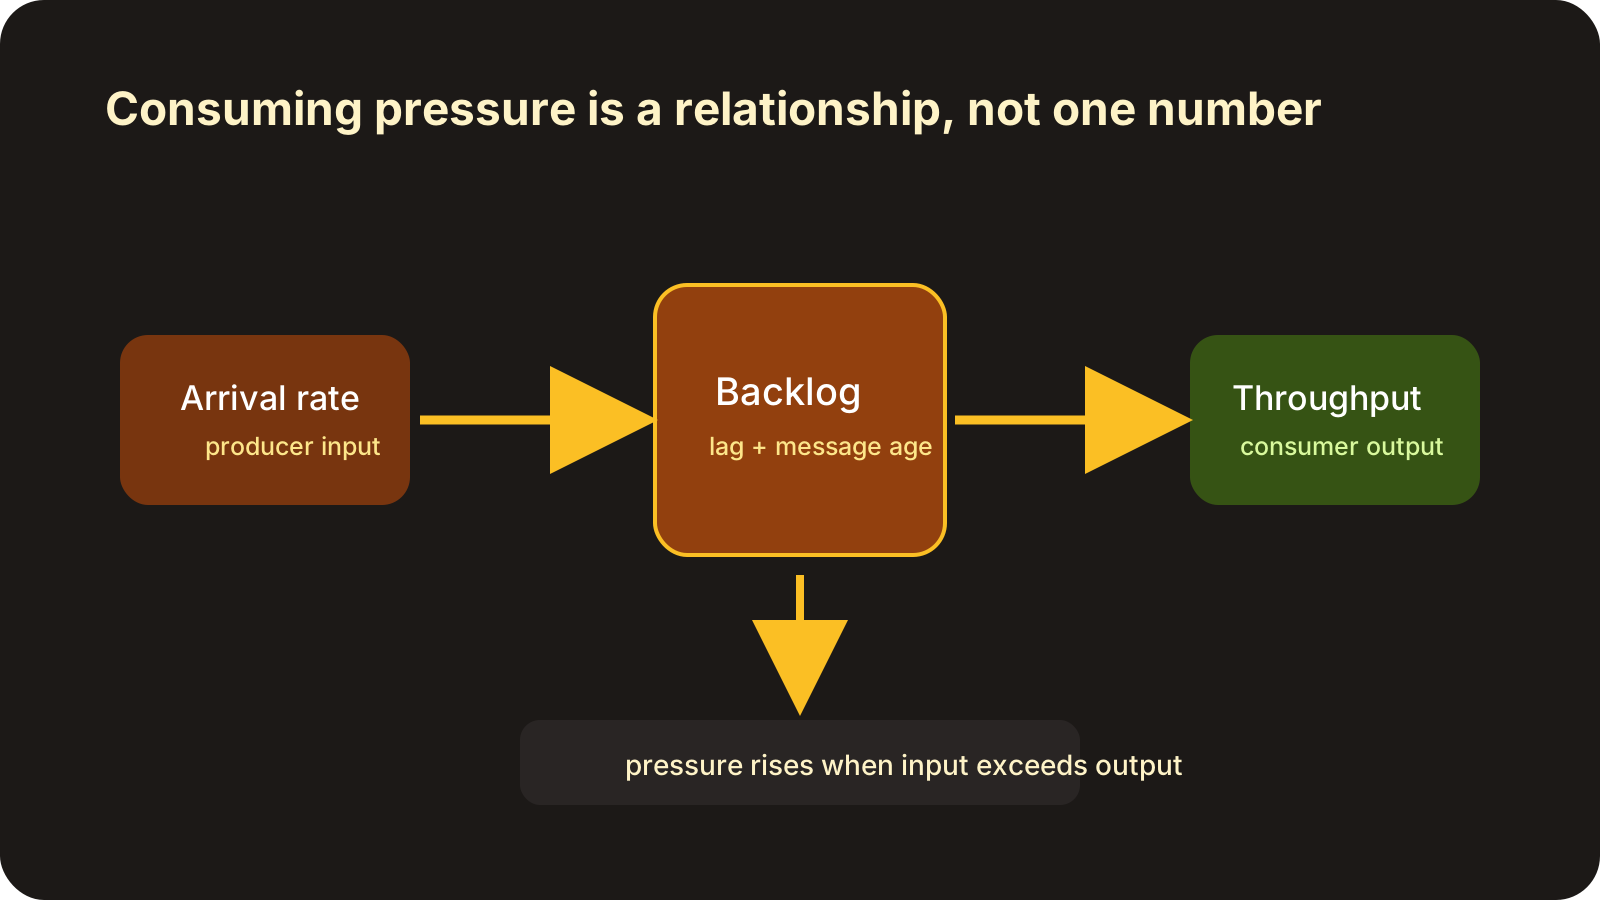
- If producer rate exceeds the consumer group’s sustainable throughput, lag naturally grows.
- Comparing current incoming traffic with the consumer group’s capacity gives a clearer operational signal.
- Looking at that ratio as 1-minute, 5-minute, and 15-minute averages can feel similar to Unix/Linux load average.
The idea is simple:
Consuming Pressure = producer rate / consumer group sustainable throughputconsumer lag tells you what has accumulated. Consuming Pressure tells you how much pressure the system is currently being asked to absorb.
What Consumer Lag tells us
In Kafka, consumer lag is roughly the difference between the latest offset in a topic partition and the offset a consumer group has committed.
lag = log end offset - committed offsetIf lag is high, the consumer group has many messages it has not processed yet. From an operations perspective, this is useful.
- It can show processing delay.
- It can reveal stopped or unhealthy consumers.
- It helps track recovery after reprocessing, batch input, or traffic peaks.
- It is a starting point for finding partition skew.
But the lag number removes a lot of context.
A lag of 100,000 is not always an incident. For a consumer group that can process 50,000 records per second, it may be a short backlog. A lag of 1,000 can still be bad if the group only processes 10 records per second and the oldest message age keeps growing.
Read the trend before the number
The first thing to read from consumer lag is direction, not size.
| State | Interpretation |
|---|---|
| Lag rises briefly and then falls | The system may be recovering from a short input spike. |
| Lag keeps rising | Current processing rate is likely below incoming rate. |
| Lag stays at a stable level | Input and processing may be balanced, or another limit may be holding recovery back. |
| Only some partitions grow | Look for partition skew, key distribution, or expensive messages. |
The better question is not “how large is lag?” It is “why is lag moving this way?”
When lag keeps growing, it is easy to assume the consumer group is broken. Sometimes it is. A consumer thread may have stopped, a downstream database may be slow, or retries may be exploding.
But the cause is not always on the consumer side.
Messages start at the Producer
The messages a consumer must process begin at the producer. If producers suddenly send far more messages than usual, lag can grow even while consumers are working normally.
Assume a consumer group can sustainably process 10,000 records per second.
| producer rate | consumer capacity | expected lag behavior |
|---|---|---|
| 6,000/sec | 10,000/sec | Existing lag can drain. |
| 10,000/sec | 10,000/sec | Lag is hard to reduce. |
| 14,000/sec | 10,000/sec | Lag grows by roughly 4,000 records/sec. |
In the third case, growing consumer lag is real. But calling it only a consumer failure points the investigation in the wrong direction. The consumer may already be doing as much work as it can. The issue is that the current producer rate exceeds that capacity.
That is why producer rate belongs next to consumer lag.
Consuming Pressure
The concept I have called Consuming Pressure in talks is intentionally simple:
Consuming Pressure = producer rate / consumer group sustainable throughputHere, producer rate is the amount of new traffic entering the topic per unit of time. consumer group sustainable throughput is the throughput that the consumer group can reliably process in its real operating environment.
The interpretation is direct:
| Consuming Pressure | Meaning |
|---|---|
< 1.0 | Current input is within processing capacity. |
= 1.0 | The group is near its limit and has little room to drain lag. |
> 1.0 | Input exceeds processing capacity; lag will grow if this continues. |
This is not a metric where “high is bad” is the whole story. It is a pressure signal for reading the operating situation.
If pressure is 1.2, current input is 20% higher than sustainable capacity. For 30 seconds, that may be fine. For 10 or 30 minutes, backlog will keep accumulating.
Read it like load average
Unix/Linux load average is usually read as 1-minute, 5-minute, and 15-minute averages. You do not read only one number; you compare short movement with the longer trend.
Consuming Pressure can be read in the same style:
Consuming Pressure
  1m:  1.35
  5m:  1.12
  15m: 0.84
This says something like: “there was a recent producer spike, the 5-minute average is also a little above capacity, but the 15-minute view may not indicate long-term overload yet.”
Now compare it with this:
Consuming Pressure
  1m:  1.08
  5m:  1.11
  15m: 1.16
The current number looks lower, but the long-term average is still above 1. The consumer group has been receiving more work than it can comfortably absorb.
Just as load average must be read with CPU count and workload type, Consuming Pressure must be read with the consumer group’s shape: partition count, consumer instance count, batch size, downstream capacity, message size, and per-message processing cost.
Defining throughput carefully
The careful part is consumer group sustainable throughput. If this number is too optimistic, pressure looks safer than it is. If it is too conservative, every normal peak looks dangerous.
In practice, it helps to derive it from several observations:
- the highest stable records/sec the consumer group handled during healthy periods
- the throughput downstream systems such as databases, external APIs, or object storage can sustain
- the point before error rate and retries start rising sharply
- the point before rebalances or GC pauses become excessive
- the throughput that actually drained lag after previous peaks
Record count alone may not be enough. One message may take 2ms to process, while another may wait 200ms on an external API. In that case, records/sec should be paired with bytes/sec, processing duration, and message-type mix.
You can also split pressure into several views:
record pressure = incoming records/sec / sustainable records/sec
byte pressure   = incoming bytes/sec / sustainable bytes/sec
cost pressure   = incoming estimated work / sustainable work capacity
You do not need a perfect model on day one. Even a simple records/sec ratio starts a better conversation than a lag number alone.
Reading Lag and Pressure together
Consumer lag and Consuming Pressure become more useful together.
| lag | pressure | interpretation |
|---|---|---|
| rising | > 1.0 | Input exceeds capacity. Look for producer spike, insufficient capacity, or scaling needs. |
| rising | < 1.0 | Capacity may be measured incorrectly, or there may be consumer bottlenecks, skew, retries, or rebalances. |
| falling | < 1.0 | The group is recovering backlog. Estimate drain time. |
| high but stable | ~ 1.0 | The group is not falling further behind, but it has little room to catch up. |
| low | > 1.0 | Early overload may not have shown up as lag yet. Watch duration. |
The last row matters. Low lag does not automatically mean safety. If pressure stays above 1, lag is likely to appear soon.
Alerting with better questions
Consumer lag alerts are still useful. But alerts based only on an absolute lag threshold often create noise.
Better alerts usually combine conditions:
lag is increasing
AND consuming pressure > 1.0 for 5 minutes
AND oldest message age is above service tolerance
Or:
lag is high
AND consuming pressure < 1.0
AND lag is not decreasing
The first alert finds cases where current input exceeds processing capacity. The second finds a stranger situation: input appears manageable, but lag is not draining. That is when you should look for stopped consumer threads, partition skew, poison messages, retry loops, or downstream bottlenecks.
A useful dashboard should place these signals together:
- total consumer lag
- per-partition lag
- lag growth rate
- producer records/sec or bytes/sec
- consumer records/sec or completion rate
- oldest message age
- consumer error rate and retry count
- rebalance count
- downstream latency
- 1-minute, 5-minute, and 15-minute Consuming Pressure
Do not judge a system by one metric
Consumer lag matters. It is hard to operate Kafka without it.
But lag is not enough on its own. It tells you how much has accumulated, but it does not directly tell you why it accumulated or whether the system can absorb the current load.
You need to see how much producers are sending, how much the consumer group can sustainably process, whether backlog is draining, and whether the delay matters to users.
Consuming Pressure is a small lens for reading that relationship.
consumer lag tells us what has accumulated.
consuming pressure tells us what the system is currently being asked to absorb.
Operations metrics should not end with one number. Good judgment comes from the relationship between signals. Consumer lag should be the start of that reading, not the final sentence on system health.
Konduo approaches Kafka from that same operational angle. It connects cluster-shaped resources such as Kafka through plugins so teams can read consumer lag, throughput, resource status, and alert response in one operating flow.
Final checklist
When building Kafka consumer lag alerts or dashboards, check these questions:
- Are we looking only at absolute lag?
- Do we track lag growth rate?
- Can we see producer rate and consumer processing rate together?
- Do we have a baseline for sustainable consumer group throughput?
- Do we know how long pressure stays above 1?
- Can we inspect per-partition lag skew?
- Does oldest message age exceed the service’s delay tolerance?
- Are retries, errors, rebalances, and downstream latency visible nearby?
- Do we avoid calling every lag increase a consumer failure?
Consumer lag is a good alarm. A good alarm should lead to better questions.
Further Reading
For more context connected to this topic, these posts are also worth reading.
- Your Kafka Looks Balanced. Your Brokers Disagree - Shows why broker load needs more than leader-count balance.
- Consumer Groups Are Not Queues: What Kafka Share Groups Change - Explains how Kafka share groups differ from ordinary consumer groups.
- Can Kafka Client Metrics Really Close the Observability Gap? - Reviews how much Kafka client metrics can close the observability gap.