Engineering Note
Can Kafka Client Metrics Really Close the Observability Gap?
A practical look at Kafka client telemetry from KIP-714: how it works, which metrics it can collect, how to configure it, and where the operational limits are.
When operating Kafka, broker metrics and consumer lag are usually the first signals we reach for. Broker metrics show request latency, throughput, quotas, network behavior, partition state, and cluster pressure. Consumer lag shows whether a consumer group is keeping up with a topic.
But those signals do not show much of what happens inside the client process.
Is a producer spending too much time with records waiting in its buffer? Is a consumer mostly idle in its poll loop? Are rebalances taking too long on the client side? Is request latency concentrated in a specific client version or client.id pattern? Broker metrics alone are not enough to answer those questions. That is why many teams add JMX, Micrometer, OpenTelemetry, or custom exporters to every Kafka application.
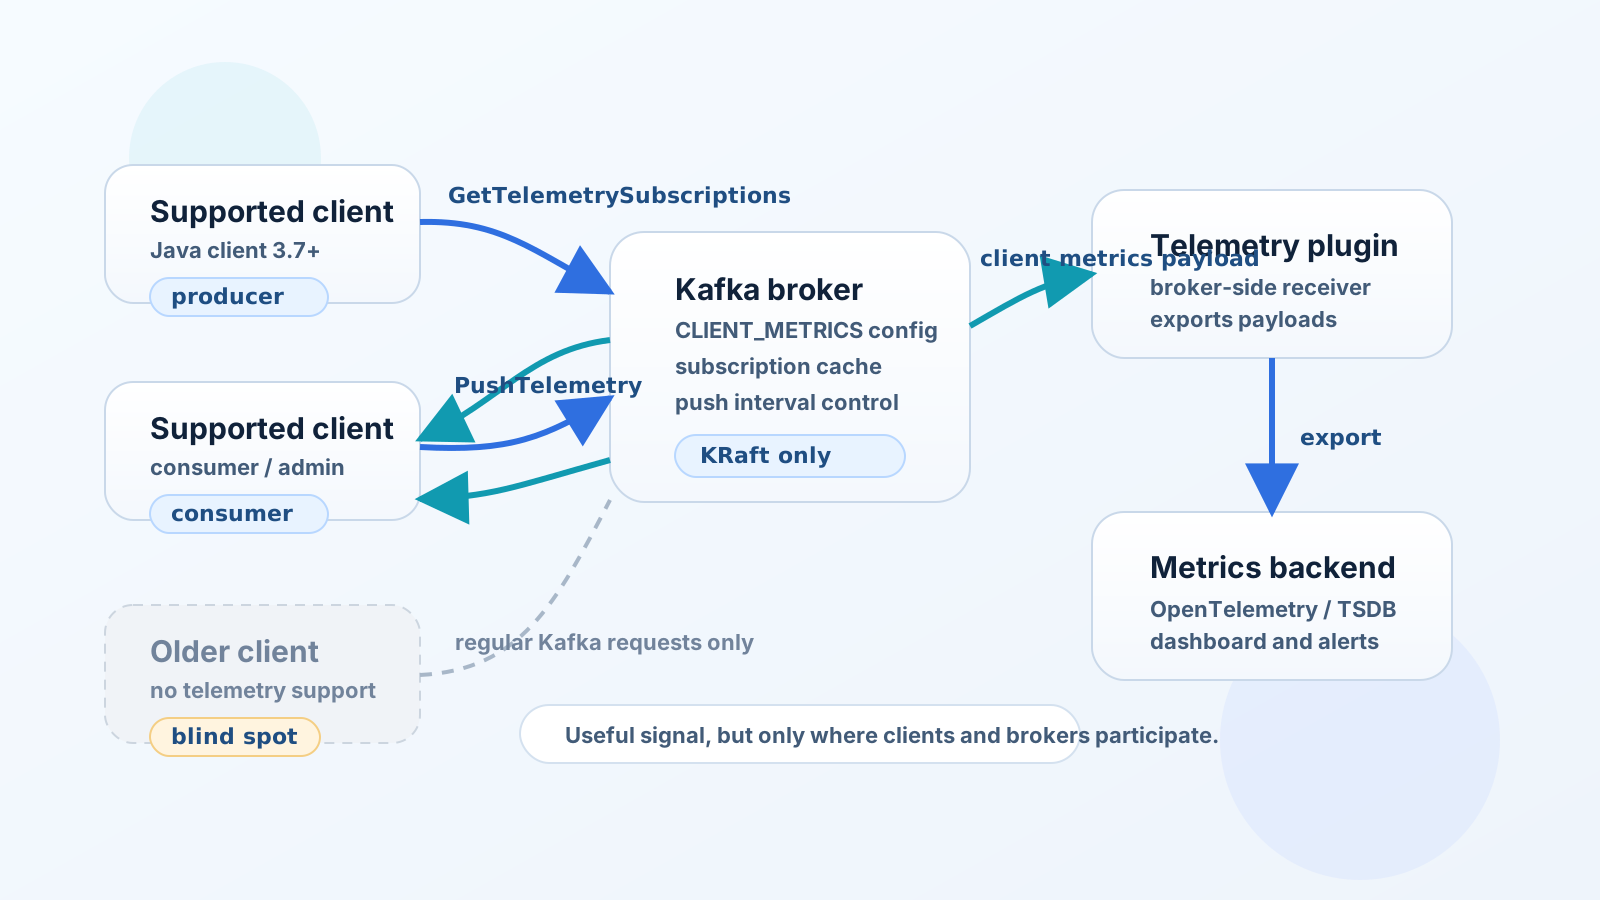
KIP-714: Client metrics and observability brings that problem into the Kafka protocol. Introduced with Kafka 3.7.0, it lets brokers tell supporting clients which metrics to report, and it lets those clients push telemetry payloads back to brokers. In Kafka 4.0, KIP-1076 extended the direction toward application-level metrics, including Kafka Streams.
The direction is good. The catch is that “clients that support this feature” and “all clients that actually produce Kafka traffic” are not the same set.
This post explains what KIP-714 does, why it was introduced, which metrics it targets, how the configuration flow works, and why it should still be treated as a partial signal in many real environments.

The Short Version
These are the main ideas to keep in mind:
- Brokers manage client metric subscriptions.
- Supporting clients call
GetTelemetrySubscriptionsand then send metrics withPushTelemetry. - Brokers usually hand the payloads to a broker-side telemetry plugin, which exports them to a metrics backend.
- The standard metrics focus on connection behavior, request latency, throttling, queue time, polling, rebalancing, fetch, and commit paths for producers, consumers, and admin clients.
- The operational value depends on how many real clients have been upgraded to versions that support the feature.
In one sentence:
KIP-714 is a useful centralized collection standard,
but in practice it observes the clients that participate, not every client that exists.
Why Client Metrics Were Needed
Kafka brokers are good at showing cluster-side state. They can tell you which broker is busy, whether request queues are growing, whether produce or fetch requests are slowing down, and whether leader election or under-replicated partitions are appearing.
But Kafka problems do not live only inside brokers.
Imagine that producers suddenly become slow. The next step depends on whether broker request latency increased, application threads are producing records slowly, batching is inefficient, the client buffer is filling up, or broker quota throttling is delaying produce requests.
Consumers have the same problem. When consumer lag grows, there are several possible explanations:
- Is the poll loop slow?
- Is record processing slow?
- Are rebalances repeating?
- Is fetch latency high?
- Are commits delayed?
- Is the application holding fetched records in an internal queue?
These questions point outside the broker and into the client process. That is why KIP-714 is a reasonable proposal. If Kafka operators can request standardized client-side metrics from the cluster side, troubleshooting can start with better evidence without asking every application team to build custom instrumentation first.
It Is Closer to Subscription-Based Push Than Remote Scraping
It is tempting to describe this as “the broker remotely collects client metrics.” The actual flow is closer to subscription-based push.
At a high level:
- The operator configures client metric subscriptions on the cluster.
- A supporting client sends a
GetTelemetrySubscriptionsrequest to a broker. - The broker returns the applicable metric prefixes, push interval, subscription id, and client instance id.
- The client sends metrics through
PushTelemetryon the requested interval. - A broker-side telemetry plugin forwards the payload to an external system such as an OpenTelemetry Collector, time-series database, or vendor backend.
This does not start automatically from the default broker configuration. KIP-714 aims for the client side to be broadly enabled in supporting clients, but collection is still an explicit broker-side choice. You need a telemetry plugin and at least one CLIENT_METRICS subscription.
There is also a KRaft requirement. KIP-714 adds a new client metrics config resource and does not add ZooKeeper storage for it. If a cluster is still ZooKeeper-based, this feature is tied to the broader cluster operating model, not just to one extra setting.
Which Metrics Can You See?
KIP-714 does not standardize every Kafka client metric. It defines standard metrics that should make sense across client implementations, and required metrics that supporting clients must provide.
Typical signals include:
| Area | Example metrics | What they help explain |
|---|---|---|
| Connections | connection.creation.rate, connection.creation.total | How often clients create broker connections |
| Request latency | node.request.latency.avg, node.request.latency.max | Request latency per broker node |
| Producer throttling | produce.throttle.time.avg, produce.throttle.time.max | Delay caused by quota or broker-side throttling |
| Producer queueing | record.queue.time.avg, record.queue.time.max | How long record batches stay in the send buffer |
| Consumer polling | poll.idle.ratio.avg | How idle or busy the consumer poll loop appears |
| Consumer rebalancing | rebalance latency and count/rate metrics | Whether group coordination is unstable from the client side |
| Fetch / commit | fetch and commit latency families | Whether consumers are delayed while fetching or committing offsets |
Metric names are represented as telemetry metric names. For example, a producer metric such as request-latency-avg becomes a name like org.apache.kafka.producer.node.request.latency.avg.
The important operational distinction is between standardized telemetry and the full set of internal Java client metrics. The Apache Kafka Java client is the reference implementation. Other client libraries can implement the standard and required metrics, but operators should not assume that every non-Java client will expose the same breadth at the same time.
What Configuration Looks Like
There are two main pieces.
First, brokers need a plugin that can receive and export client telemetry. Apache Kafka provides the broker-side plugin interface, but the actual destination depends on the distribution, plugin, and operating environment. The plugin might forward payloads to an OpenTelemetry Collector or another metrics backend.
Second, the cluster needs a client metrics subscription. KIP-714 adds the CLIENT_METRICS config resource, and KIP-1000, mentioned in the Kafka 3.7.0 release announcement, made these resources manageable through existing tools such as kafka-configs.sh.
A simplified example looks like this:
kafka-configs.sh --bootstrap-server "$BROKERS" \
  --entity-type client-metrics \
  --entity-name "java-producer-observability" \
  --alter \
  --add-config "metrics=[org.apache.kafka.producer.node.request.latency.,org.apache.kafka.producer.record.queue.time.],interval.ms=30000,match=[client_software_name=apache-kafka-java,client_id=orders-.*]"
Read it as:
metrics: telemetry metric prefixes to requestinterval.ms: how often matching clients should push metricsmatch: selectors that decide which clients receive the subscription
Selectors can use fields such as client instance id, client id, client software name/version, and source address/port. But they only apply to clients that participate in the telemetry protocol. Older or unsupported clients never enter this matching flow.
Where This Is Useful
KIP-714 is not useless. Under the right conditions, it can be a very useful supporting signal.
It is especially helpful when:
- the platform team manages Kafka but application instrumentation differs from team to team
- most Kafka applications use Java clients and client library upgrades are controlled
- operators want to narrow problems by client version,
client.id, or source address - producer queue time, request latency, and throttle time need to be correlated with broker metrics
- new services need a baseline client-side observability standard
For example, if broker produce request latency increases and only a specific client family shows rising record.queue.time.max, that narrows the investigation. If consumer lag grows while poll.idle.ratio.avg drops and rebalance latency rises, it suggests looking at consumer processing or group coordination before blaming the broker.
The feature does not explain incidents automatically. It gives operators a more standardized set of signals for narrowing the next question.
Why This Is Still Not Enough
My caution is mostly about adoption reality, not the protocol design.
First, every important client has to be upgraded.
Operators do not want visibility into “the services that upgraded nicely.” They want visibility into the services that actually generate Kafka traffic. In a real organization, that set can include old Java clients, Spring Kafka wrappers, Kafka Streams apps, Kafka Connect connectors, Flink jobs, librdkafka-based services, Python/Go/Node clients, vendor SDKs, and one-off batch utilities. Getting all of those onto supporting versions can take longer than a broker upgrade.
Second, non-Java client adoption is hard for platform teams to control.
KIP-714 uses the Java client as the reference implementation. Other clients can implement the standard metrics, but the timing and coverage depend on each project or vendor. The client that causes the most operational pain may be exactly the one that does not support telemetry yet.
Third, partial visibility can be more dangerous than no visibility.
Once dashboards show client telemetry, it is easy to feel that the platform has full Kafka client visibility. But the dashboard only contains the clients that send telemetry. The more polished the dashboard looks, the easier it is to hide the coverage gap.
Fourth, brokers take on extra responsibility.
Push interval rate limiting, payload size, plugin export behavior, metrics backend cost, state loss across broker restarts, and subscription design all become operating concerns. Client metrics are not free signals.
Fifth, client metrics do not explain application causes by themselves.
Telemetry can show Kafka client internals, but business processing time, downstream API latency, database locks, application thread pool saturation, and framework-level retries still require application metrics and logs.
How I Would Use It
A practical adoption stance looks like this:
| Situation | Recommendation |
|---|---|
| New Java services | Worth enabling, with clear client.id and version rules. |
| Mostly Java, centrally managed upgrades | Reasonable candidate for a platform baseline. |
| Mixed language and library environment | Treat it as partial telemetry, not a full observability strategy. |
| ZooKeeper cluster | Lower priority unless KRaft migration is already planned. |
| Teams already have strong app metrics | Check whether broker-side correlation adds enough value. |
| Dashboards | Always show coverage ratio next to metric values. |
Coverage ratio matters.
Kafka client telemetry dashboard =
  metric values
  + which clients are included
  + which clients are missing
Without the third line, the dashboard can create false confidence.
A Konduo Angle
When reading Kafka, brokers, topics, partitions, and consumer groups should be treated as operational signals, not only as code concepts. Konduo connects clustered resources such as Kafka through plugins so teams can inspect state, metric evidence, diagnostics, and alert response in one operating flow. Client telemetry from KIP-714 is most useful when it is interpreted alongside broker metrics, consumer lag, log evidence, and application metrics instead of being treated as the single source of truth.
Pre-Adoption Checklist
Before adopting KIP-714, check these questions first:
- Is the Kafka cluster running in KRaft mode?
- Which broker-side telemetry plugin will receive metrics, and where will it export them?
- What percentage of real Kafka clients are on versions that support telemetry?
- Can dashboards separate Java client coverage from non-Java client coverage?
- Are
client.idconventions consistent enough for operators to understand? - Are subscriptions narrow enough to avoid unnecessary broker and metrics backend load?
- Do dashboards show both visible clients and missing clients?
- How will this signal relate to app metrics, JMX, broker metrics, lag, and log evidence?
Closing Thought
KIP-714 addresses a real Kafka operations problem. Moving client-side visibility into a standardized protocol and broker-managed subscription model is valuable.
But it does not instantly create full client observability. Its value grows with the number of participating clients, and its blind spots grow with the number of old or unsupported clients. In organizations with mixed languages and long client upgrade cycles, those blind spots are not small.
So I would not treat this as a replacement for application metrics, broker metrics, lag, and logs. I would treat it as broker-mediated telemetry that is useful where it exists.
Good operational judgment does not come only from collecting more numbers. It starts with knowing which numbers are visible and which ones are still missing.
Further Reading
For more context connected to this topic, these posts are also worth reading.
- JVM Metrics Alone Cannot Explain a Container - Explains why cgroup, filesystem, fd, and I/O signals matter beyond JVM metrics.
- Your Kafka Looks Balanced. Your Brokers Disagree - Shows why broker load needs more than leader-count balance.
- Consumer Lag Is Not a Health Score: Thinking in Kafka Consuming Pressure - Reframes consumer lag as processing pressure.