Engineering Note
JVM Metrics Alone Cannot Explain a Container
Introducing Pletor node-metrics-agent, an open source JVM agent that exposes host and container node metrics through JMX and works well with Prometheus JMX exporter.
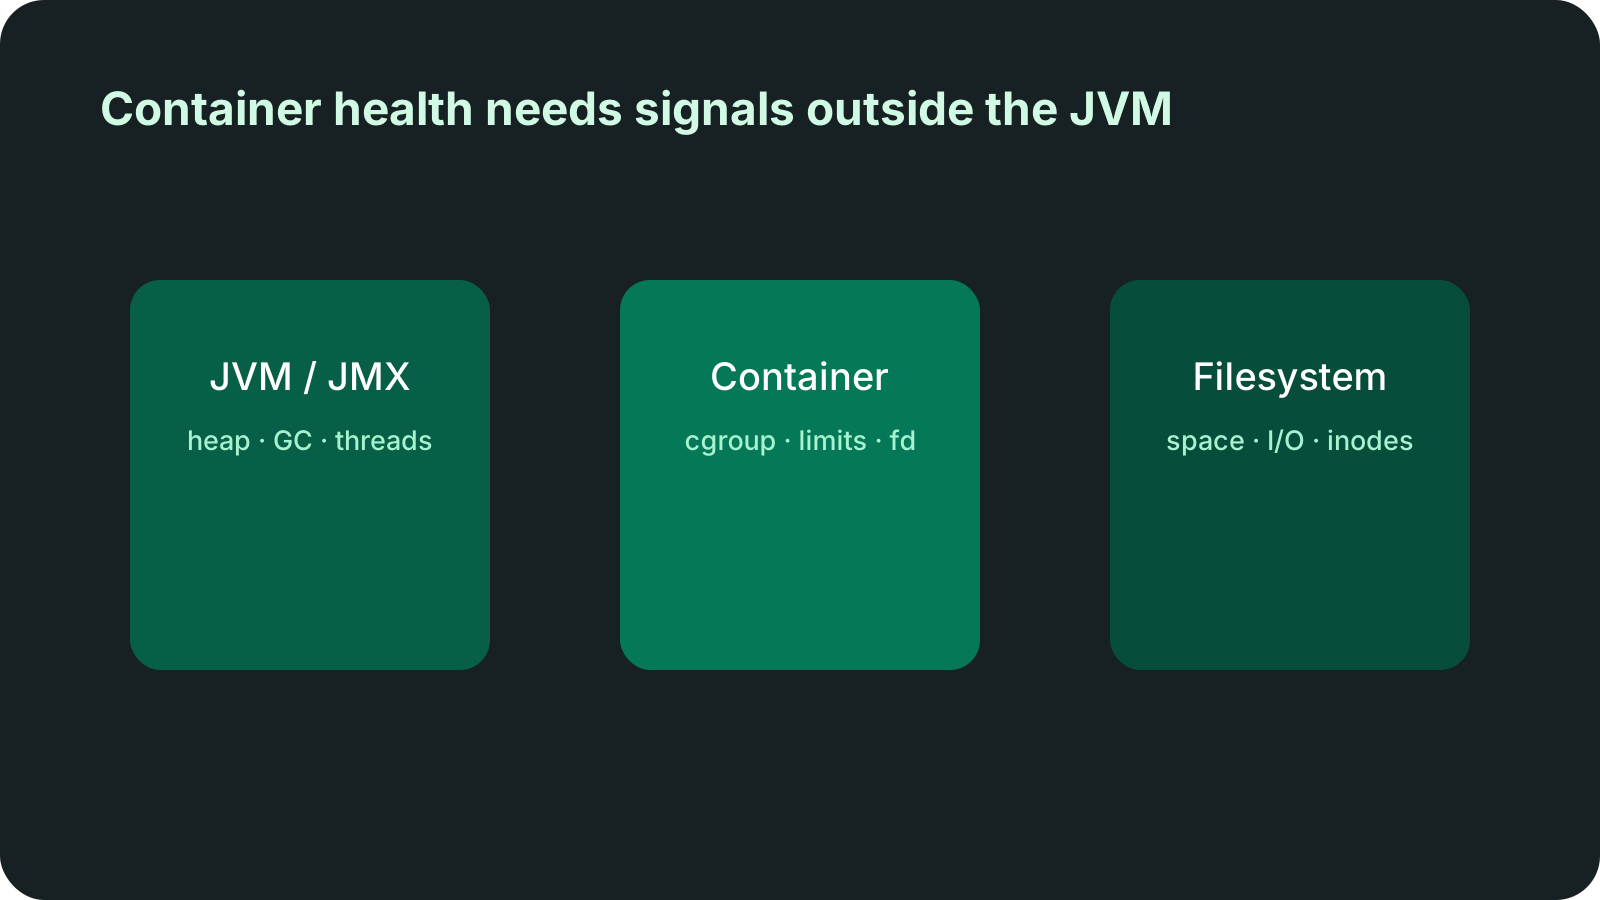
JVM metrics are essential when operating Java applications in containers. Heap, GC, threads, class loading, and safepoints are still the basic signals for understanding application health.
But container problems are not always explained from inside the JVM.
The JVM looks fine, but the container is slow.
Heap has room, but cgroup memory pressure is rising.
Application latency grows, but the cause is filesystem, fd, or I/O behavior.
Those cases need runtime-environment signals alongside JVM signals. That is why Pletor has released node-metrics-agent as open source.
node-metrics-agent is a lightweight JVM agent that attaches to a Java application. It reads host and container node metrics from inside the application process and registers them as JMX MBeans. It does not open an HTTP /metrics endpoint by itself. For Prometheus collection, the recommended path is to use it with the Prometheus JMX exporter.

Why Signals Outside the JVM Matter
Containerized Java applications often have an observability gap.
JVM metrics explain the JVM well. They do not fully explain the execution environment around the JVM.
Questions like these appear quickly:
- What CPU load does the container see?
- How does cgroup memory usage move differently from JVM heap?
- Is there enough free space on the filesystem paths the application uses?
- Are open file descriptors approaching a limit?
- Does process-level I/O rate move with application latency?
- Is the metrics agent itself adding pressure while collecting data?
The traditional answer has often been to run node_exporter as another process, sidecar, or DaemonSet. That is still a valid pattern. For whole-host observability or Kubernetes node-level monitoring, node_exporter may be the more natural choice.
But for one Java application container, adding another process is not always the simplest path. JVM metrics may already be collected with JMX exporter, while node-adjacent signals come from a different exporter and need to be joined again in dashboards and alert rules.
node-metrics-agent is meant to reduce that gap.
What node-metrics-agent Does
node-metrics-agent attaches as a JVM agent.
java \
  -javaagent:/path/to/node-metrics-agent-0.8.0-all.jar=/path/to/node-metrics.yml \
  -jar your-app.jar
The agent reads node/container-related information from inside the JVM and exposes it as JMX MBeans. Based on the README, the current version is 0.8.0, the runtime target is Java 11+, and builds require JDK 21.
The registered MBean range is:
| MBean | Meaning |
|---|---|
co.pletor.node:type=CpuMetrics | node CPU metrics |
co.pletor.node:type=MemMetrics | node memory metrics |
co.pletor.cgroup:type=MemMetrics | cgroup memory metrics |
co.pletor.proc:type=FdMetrics | process file descriptor metrics |
co.pletor.node:type=IoRates | I/O rate metrics |
co.pletor.node:type=OsInfoMetrics | OS information |
co.pletor.node:type=OsRuntimeMetrics | OS runtime metrics |
co.pletor.node:type=FsMetrics,path=<configured path> | filesystem metrics for configured paths |
co.pletor.agent:type=TelemetryMode | agent telemetry mode |
co.pletor.agent:type=Observability | agent queue, drop, latency, and staleness observability |
The important point is that this is not just “more JVM metrics.” It brings part of the container execution environment into the same JMX observability path as the application.
Using It with JMX exporter
node-metrics-agent does not expose its own HTTP endpoint. That is intentional. If a Java service already uses JMX exporter, the same path can expose these metrics.
A common launch shape is:
java \
  -javaagent:/opt/jmx-exporter/jmx_prometheus_javaagent.jar=9404:/opt/jmx-exporter/pletor-node-metrics.yml \
  -javaagent:/opt/pletor/node-metrics-agent-0.8.0-all.jar=/opt/pletor/node-metrics.yml \
  -jar your-app.jar
This attaches two agents to the JVM:
- JMX exporter turns JMX MBeans into a Prometheus scrape endpoint.
node-metrics-agentregisters node/container metrics as JMX MBeans.
Prometheus can then scrape metrics with the pletor_* prefix. The README includes examples such as:
pletor_node_cpumetrics_systemcpuload
pletor_node_memmetrics_availablememorybytes
pletor_cgroup_memmetrics_memoryusagebytes
pletor_proc_fdmetrics_openfiledescriptorcount
pletor_agent_observability_queuefillratio
If JMX exporter is already the standard collection path for your Java services, this avoids adding another HTTP exporter process just to collect a focused set of node/container metrics.
Why It Helps in Containers
In a container, the “node” visible to an application may not be the same as the whole physical or virtual host. Namespaces, cgroups, mounted filesystems, and container runtime settings shape what the application experiences.
The useful question is often not “How is the host?” but “What constraints does this JVM’s execution environment have?”
node-metrics-agent fits especially well when:
- the application is a Java service running in a container
- JVM metrics are already collected through JMX exporter
- you want CPU, memory, cgroup memory, fd, filesystem, and I/O signals visible from the application container
- a JVM agent is simpler to deploy than an additional node_exporter sidecar
- you want Prometheus metrics separated with a
pletor_*prefix
The boundary matters. This is not a complete replacement for every node_exporter use case. For whole-host observability, network device detail, or node-wide multi-process monitoring, node_exporter or Kubernetes/cAdvisor metrics may still be a better fit.
The role of node-metrics-agent is narrower and more application-centered:
Let the application JVM describe the execution environment around it through JMX.What Matters in Production JVMs
Attaching an agent to a production JVM should always be treated carefully. A metrics agent should not disturb the application hot path.
The README describes node-metrics-agent as having a fail-open posture:
- bounded asynchronous refresh pipeline
- overload modes:
NORMAL,DEGRADED,BYPASS - runtime configuration reload for filesystem metrics
- self-observability MBeans for queue pressure, drops, latency, and staleness
That direction is important. For metrics agents, “always compute the freshest value at any cost” is often less useful than “keep observability without interfering with the application.” This matters when watching multiple filesystem paths, reading I/O-adjacent signals, or tuning refresh intervals.
That makes co.pletor.agent:type=Observability more than a nice extra. In production, the agent’s own pressure should be monitored too.
Configuration and Filesystem Metrics
Filesystem metrics depend on path selection. Instead of scanning everything, configure the mount paths the application actually uses.
Example:
fsmetrics_max_partitions: 32
fsmetrics_paths:
  - /data/kafka-logs
  - /boot
The JAR can also generate configuration files:
java -jar node-metrics-agent-0.8.0-all.jar init-config --fs-path /data,/var
java -jar node-metrics-agent-0.8.0-all.jar init-kafka-config \
  --server-properties /opt/kafka/config/server.properties
That can be useful for Java-based systems such as Kafka where storage paths are explicit. Still, generated configuration should be reviewed against the real container mounts, volumes, and runtime paths.
Operational Checklist
Before adopting it, check these points:
| Area | What to check |
|---|---|
| Java version | runtime Java 11+ |
| exporter setup | whether JMX exporter will run alongside the app |
| port | whether the JMX exporter HTTP port conflicts with existing ports |
| filesystem paths | whether configured paths match real container mounts |
| cardinality | whether path-based MBeans and Prometheus labels stay bounded |
| self-observability | queue fill, drops, latency, and staleness |
| fallback behavior | whether agent issues pass without affecting the app |
| existing node metrics | how this overlaps with node_exporter, cAdvisor, or kubelet metrics |
This operational angle is also central to Konduo. Konduo connects operating targets such as Kafka, PostgreSQL, and hosts through plugins so teams can read resource status, metric evidence, and alert response in one operating flow. That connected view matters when JVM signals and container runtime signals need to be interpreted together.
Conclusion
For Java applications in containers, JVM metrics are necessary but not sufficient. Even when the JVM looks healthy, cgroup memory, filesystem, fd, I/O, and OS runtime signals may explain the actual behavior.
node-metrics-agent is a small tool for bringing those signals into the Java application’s observability path.
Connect metrics inside the JVM and around the JVM
through the same JMX/Prometheus route.
If you often ask “The JVM looks fine, so why is the service slow?”, the application can now describe more of the environment it is running in.
Further Reading
For more context connected to this topic, these posts are also worth reading.
- Why Did Kafka OOM When Memory Was Still Available? - Revisits Kafka broker memory with heap, page cache, and direct buffers in view.
- The Kafka Broker Slowed Down, but Kafka Was Not the Cause - Tracks a Kafka symptom down to storage path and I/O behavior.
- From Env to Config: The Last Mile of Container Configuration - Covers the pattern of turning container environment variables into real config files.