Engineering Note
The Kafka Broker Slowed Down, but Kafka Was Not the Cause
A practical incident-style walkthrough of a Kafka broker throughput drop, follower replicas falling out of ISR, and the storage path contention below the VM.
When a Kafka incident starts, the first signals we usually see are Kafka signals.
Broker throughput drops, under-replicated partitions increase, ISR shrink appears, and one broker looks slower than the others. The natural response is to investigate Kafka itself: broker logs, controller events, JVM, GC, network threads, request handlers, replica fetchers, and partition leadership.
But sometimes Kafka metrics are symptoms, not causes.
In one Kafka cluster with roughly twelve brokers, one broker suddenly showed a sharp throughput drop. For partitions where that broker hosted follower replicas, some followers could not keep up with their leaders and fell out of the ISR. Some client-facing traffic also looked unstable around partitions associated with that broker.
At first, it looked like a Kafka replication problem. But broker logs and JVM metrics did not show a decisive error. As the investigation continued, the interesting signals appeared below Kafka. On the affected broker VM, CPU iowait, /proc/meminfo fields such as Dirty and Writeback, and block device write latency signals were abnormal.
The root cause was not inside Kafka. The broker VMs were using block storage that looked like a normal disk from inside the guest OS, but underneath it was network storage. The broker that lost the storage contention race became the broker that looked slow from Kafka’s point of view.
This post uses that experience to explain how to follow a Kafka symptom down into the storage path. The core lesson is simple:
An operating system is not explained by one metric from one layer.
Requests move through the application, OS, block device, hypervisor, network, and storage backend.
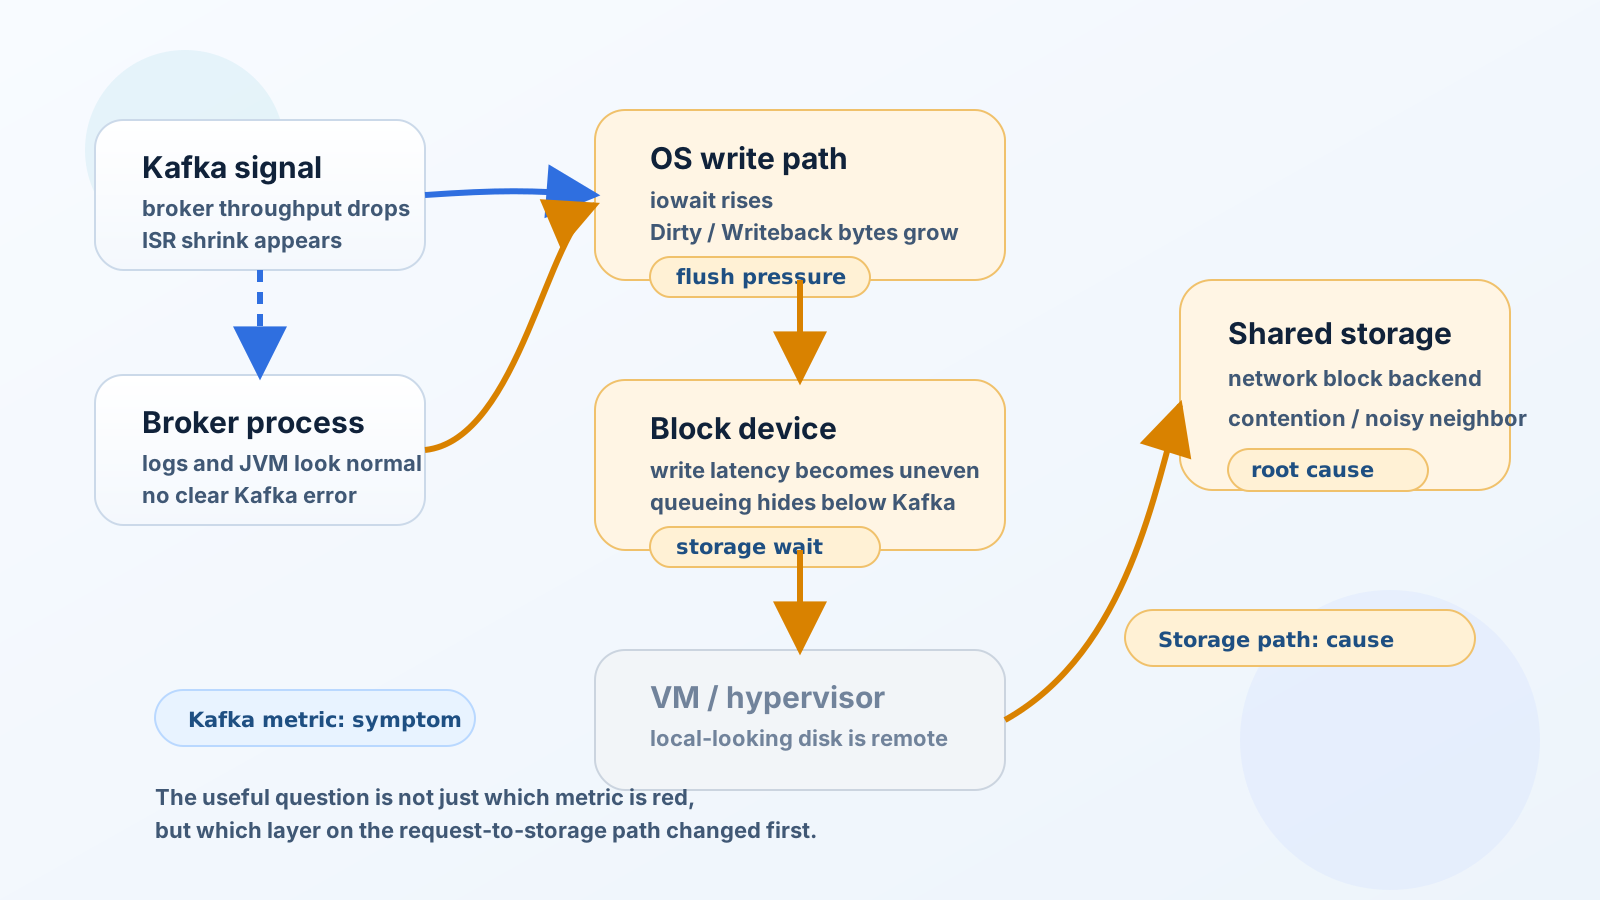
It Looked Like a Kafka Problem
The first symptoms looked internal to Kafka:
- produce/fetch throughput dropped on one broker
- ISR shrink appeared around partitions related to that broker
- replication lag looked concentrated around one broker
- leader movement or client request latency appeared in the same window
- other brokers looked relatively normal
The first investigation pass was therefore inside Kafka:
- Are there disk errors, request timeouts, or replica fetcher errors in broker logs?
- Did GC pauses become longer?
- Are network processors or request handlers saturated?
- Are controller events or leader elections repeating?
- Is partition leadership heavily concentrated on one broker?
- Did producer traffic or consumer fetch behavior change suddenly?
None of those explained the incident clearly. Kafka logs were quiet. JVM behavior did not point to a root cause. Broker metrics identified the slow broker, but they did not explain why it was slow.
At that point, the useful question was what the visible symptoms could tell us, and where they stopped being enough. ISR shrink and replication lag clearly pointed at the slow broker. They did not explain why that broker became slow, or whether the cause lived inside the Kafka process, the host, or a deeper write path below the VM.
What Kafka Metrics Did Not Explain
Kafka brokers are disk-backed log servers. Produce requests pass through memory and page cache before being written to log segments. Follower replicas also write fetched records into their own local logs. Whether a broker is acting as leader or follower, a weak write path can surface as several Kafka-level symptoms.
But broker metrics alone do not expose the full path underneath.
| Kafka symptom | What it does not explain by itself |
|---|---|
| broker throughput drops | whether traffic dropped or the write path slowed |
| ISR shrink | whether follower fetch, follower write, or leader response slowed |
| request latency rises | whether Kafka threads or disk flushes are the bottleneck |
| only one broker is slow | whether the cause is broker config, VM placement, or storage backend |
At that point, the investigation moved down into the OS.
The Strange Signals Were in the OS Write Path
Kafka did not provide a decisive error, but host metrics did.
The notable signals were:
- CPU
iowaitshare rose above the normal baseline /proc/meminfoDirtystayed elevated longer than usual/proc/meminfoWritebackorWritebackTmpspiked- block device write latency and in-flight I/O were uneven across brokers
- Kafka throughput drop lined up with dirty page writeback pressure
The important point is not to look at iowait alone and immediately declare “disk problem.” iowait only says that CPU time is being spent waiting for I/O completion. Dirty is the amount of page cache data not yet written to storage, and Writeback is the amount currently being written back. Block device latency and in-flight I/O are needed to interpret the write path more confidently.
In practice, these are the kinds of signals to inspect together:
vmstat 1
iostat -xz 1
sar -d 1
cat /proc/meminfo | egrep 'Dirty|Writeback'
With node_exporter, the names can be more precise:
| What to inspect | node_exporter metric / PromQL example | How to read it |
|---|---|---|
| CPU iowait share | node_cpu_seconds_total with mode="iowait" | Share of CPU time spent waiting for I/O completion |
| dirty page bytes | node_memory_Dirty_bytes | Dirty page cache data not yet written back to storage |
| writeback bytes | node_memory_Writeback_bytes | Pages currently being written back |
| temporary writeback bytes | node_memory_WritebackTmp_bytes | Temporary writeback accounting, often relevant for paths such as FUSE |
| dirty page ratio | node_memory_Dirty_bytes / node_memory_MemTotal_bytes | Dirty page pressure relative to host memory |
| write throughput | node_disk_written_bytes_total | Bytes written per second to the block device |
| write latency | rate(node_disk_write_time_seconds_total[5m]) / rate(node_disk_writes_completed_total[5m]) | Average time per completed write, close to the iostat await idea |
| in-flight I/O | node_disk_io_now | Number of I/O operations currently in progress |
| device busy time | rate(node_disk_io_time_seconds_total[5m]) | A signal close to device busy time ratio |
| weighted I/O time | rate(node_disk_io_time_weighted_seconds_total[5m]) | Accumulated time weighted by queued and in-flight I/O |
| flush latency | rate(node_disk_flush_requests_time_seconds_total[5m]) / rate(node_disk_flush_requests_total[5m]) | Average flush request time when the kernel/exporter exposes flush metrics |
node_memory_Dirty_bytes and node_memory_Writeback_bytes are exported by the node_exporter meminfo collector from /proc/meminfo. For disk latency, raw counters such as node_disk_write_time_seconds_total are easier to interpret when divided by completed write count. await is an iostat term, so in Prometheus it is better to show the derived query explicitly.
/proc/vmstat also has page-count fields such as nr_dirty and nr_writeback, but the node_exporter vmstat collector can have a limited default field filter. If the article assumes default node_exporter coverage, meminfo-based node_memory_Dirty_bytes and node_memory_Writeback_bytes are the safer names to use first.
In PromQL, a starting point looks like this:
avg by (instance) (rate(node_cpu_seconds_total{mode="iowait"}[5m]))

rate(node_disk_written_bytes_total{device=~"nvme.*|vd.*|sd.*"}[5m])

rate(node_disk_write_time_seconds_total[5m])
/
rate(node_disk_writes_completed_total[5m])
And from Kafka, line them up with the same time window:
broker bytes in/out
produce/fetch request latency
under replicated partitions
ISR shrink / expand rate
replica fetcher lag
request handler idle ratio
The timeline matters. A single metric says less than the order in which signals changed.
The Disk Was Not Really Local
The deeper investigation revealed the key fact.
The broker VMs were using block devices that looked like ordinary disks from inside the guest OS. But underneath, those devices were backed by network storage. Between the broker process and the actual storage backend sat the guest kernel, block device layer, hypervisor, network path, and shared storage system.
The affected broker lost out under contention in that shared storage path. Its write latency became unstable, and page cache Dirty/Writeback behavior changed. Kafka then showed the consequences:
- lower produce throughput
- slower local log writes for follower replicas
- replicas that could not keep up with leaders
- more ISR shrink
- one broker that looked slow to clients and operators
Looking only at the broker process was not enough. Kafka was trying to write its logs. The JVM was not obviously broken. The slow point was below the broker, in the storage path.
Why Network Block Storage Needs Care
The conclusion is not “never use network storage for Kafka.” Some environments provide provisioned IOPS, latency SLOs, dedicated paths, local SSD caching, single-tenant storage, or cloud-provider guarantees.
But Kafka brokers are sensitive to storage latency. In a cluster with steady throughput, uneven broker-level storage latency can disturb replication and leadership distribution.
Network block storage is especially tricky because:
- a device can look local inside the VM while the bottleneck is outside the VM
- other workloads can affect the same backend
- tail latency may matter more than average latency
- identical VM specs do not guarantee identical storage paths
- guest OS metrics and provider or hypervisor metrics may tell different parts of the story
Adding brokers does not automatically make Kafka stable. If storage paths are uneven, one slow broker can still affect replication health.
A Better Investigation Path
After this incident, I prefer to inspect Kafka broker anomalies in this order:
- Confirm the Kafka symptom.
- Throughput, request latency, ISR shrink, under-replicated partitions, and replica fetcher lag.
- Check whether the symptoms concentrate around one broker.
- See whether leadership, replica lag, and client request latency cluster around the same broker.
- Inspect JVM and broker threads.
- GC, network/request handlers, request queues, and indirect page cache symptoms.
- Move down to the OS write path.
- Inspect
node_cpu_seconds_totalwithmode="iowait",node_memory_Dirty_bytes,node_memory_Writeback_bytes,node_disk_write_time_seconds_total,node_disk_writes_completed_total, andnode_disk_io_now.
- Inspect
- Check below the VM.
- Hypervisor host, storage backend, network storage contention, and provider metrics.
- Align the timeline.
- Which layer changed first?
The point is not merely “look at OS metrics after Kafka metrics.” The point is to connect metrics along a path:
produce request
-> broker append path
-> page cache dirty pages
-> kernel writeback
-> block device queue
-> hypervisor / network
-> storage backend
Delay at any point can appear above as lower throughput, higher request latency, replication lag, or ISR shrink.
A Konduo Angle
This topic ultimately comes down to how operators read status and evidence across layers. Konduo connects infrastructure resources through plugins so teams can inspect resource state, metric and log evidence, alert response, access control, and operating history in one flow. A Kafka broker problem rarely stops at Kafka metrics; it becomes more understandable when host, storage, log evidence, and alert history are read together.
Checklist for the Next Incident
If a similar pattern appears again, start with these questions:
- Do Kafka symptoms repeatedly concentrate around one broker?
- Do replication lag, ISR shrink, and request latency move together in the same time window?
- If broker logs, JVM, and GC do not explain the issue, did you inspect the OS write path?
- Are
node_memory_Dirty_bytesandnode_memory_Writeback_bytesoutside the normal baseline? - Is derived write latency from
node_disk_write_time_seconds_total / node_disk_writes_completed_totaluneven across brokers? - Do
node_disk_io_nowornode_disk_io_time_weighted_seconds_totalshow in-flight I/O or queueing pressure at the same time? - Is the VM block device truly local, or backed by network storage?
- Can you see other workloads or tenants sharing the same storage backend?
- Did you align Kafka, OS, and storage metrics on the same timeline?
Closing Thought
A Kafka broker does not slow down in isolation.
Producer requests, page cache dirty pages, writeback, block devices, hypervisors, and network storage backends form one path. When a lower layer shakes, Kafka can show the symptom as ISR shrink, leader movement, or throughput loss.
Incident analysis is not only about collecting more metrics. It is about understanding where each metric sits on the path. Kafka ISR shrink may begin as a Kafka metric, but the answer can live in OS writeback or a storage backend.
Operators should follow the full path a request takes, not only the red number on the first dashboard.
Further Reading
For more context connected to this topic, these posts are also worth reading.
- Why Did Kafka OOM When Memory Was Still Available? - Revisits Kafka broker memory with heap, page cache, and direct buffers in view.
- Your Kafka Looks Balanced. Your Brokers Disagree - Shows why broker load needs more than leader-count balance.
- JVM Metrics Alone Cannot Explain a Container - Explains why cgroup, filesystem, fd, and I/O signals matter beyond JVM metrics.