Engineering Note
Why Did Kafka OOM When Memory Was Still Available?
Kafka broker memory is not just heap and page cache. Direct buffers can fail allocation even when system memory and heap graphs still look healthy.
Kafka broker memory is often explained with a familiar split:
Kafka heap
OS page cache
That split is not wrong. Kafka is a JVM application, and it reads and writes log segment files heavily, so page cache matters a lot. The common advice to avoid giving all memory to the heap and to leave room for page cache is still valid.
But in real operations, that model can miss an important memory class.
I once ran into exactly that kind of problem. System memory looked available. Kafka heap was not full. GC metrics did not point to a heap exhaustion problem. Still, the broker reported a memory allocation failure.
At first, the situation looked contradictory.
OS available memory was still there.
Kafka heap usage had room.
The broker still failed memory allocation.
The missing category was direct buffer memory.
That is the core point of this post: Kafka can OOM even when physical memory is still available. If the broker asks for a direct buffer beyond the JVM’s direct memory limit, allocation can fail from the JVM’s point of view even though the OS still appears able to provide more memory.

OOM Can Happen While Heap Looks Fine
When a Java application reports OOM, we often think of heap first.
java.lang.OutOfMemoryError: Java heap spaceFor that error, heap dumps, object histograms, GC logs, and allocation paths are the right places to look. Kafka brokers can certainly have heap problems.
But the issue I saw was not heap OOM. It was closer to direct memory allocation failure.
java.lang.OutOfMemoryError: Direct buffer memoryDepending on the JVM and library path, it may also appear as:
Cannot reserve ... bytes of direct buffer memoryIn that case, low heap usage is not surprising. Direct buffers live outside the Java heap.
The Java ByteBuffer documentation explains that direct buffers are used so the JVM can try to perform native I/O operations directly, and their contents may reside outside the normal garbage-collected heap. Their impact on application memory footprint may therefore not be obvious.
So “heap has room” does not mean the Kafka process is safe from memory allocation failures.
The Missing Slot in Kafka Memory Accounting
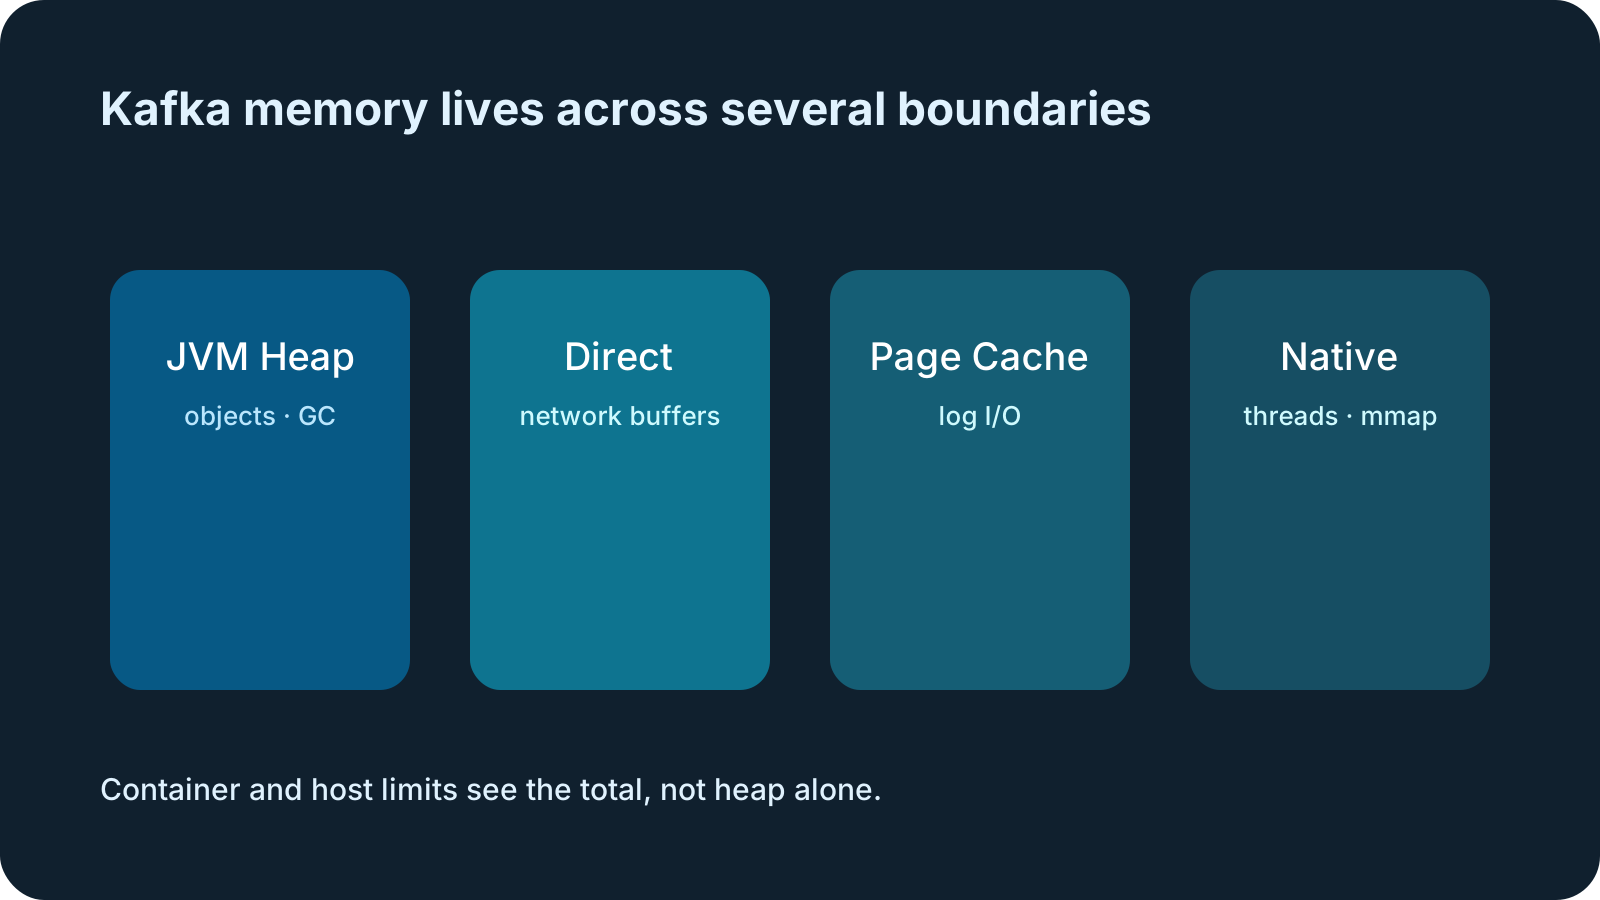
A more realistic Kafka broker memory budget needs at least these categories:
Java heap
JVM native memory
Direct buffer
Thread stack
Metaspace
Code cache
OS page cache
OS and filesystem safety margin
Operators often watch heap and OS memory first. Direct buffer memory sits in an awkward middle area.
- It does not show up as Java heap usage.
- It may contribute to RSS, but RSS does not tell you which part is direct buffer.
- It is not the same as page cache.
- If
-XX:MaxDirectMemorySizeis reached, allocation can fail even when system memory is still available.
That last point is the trap.
Memory allocation failure does not always mean physical memory is fully exhausted. It can also mean the JVM reached the limit it allows for direct buffers. When that happens, heap and OS memory graphs alone can leave operators asking the wrong question.
The MaxDirectMemorySize Trap
The JVM has a -XX:MaxDirectMemorySize option for controlling the direct buffer memory limit.
The awkward part is what happens when this value is not set explicitly. The OpenJDK JDK-8345611 release note explains that MaxDirectMemorySize controls the maximum total size of memory that may be used for direct buffers in a JVM instance, and that its default value is the maximum heap size. It also notes an accounting change for internal temporary direct buffers as of JDK 24, so details should always be checked against the JDK version in use.
In many Kafka deployments, this option is not set separately. Operators usually configure heap through KAFKA_HEAP_OPTS or JVM options, but they less often design and set -XX:MaxDirectMemorySize explicitly. In that case, the broker relies on the JVM default.
The incident I saw was close to this. The system was not simply out of physical memory. It looked more like the JVM failed allocation when the broker asked for more direct buffer memory than the configured or default direct memory limit allowed. OS memory and heap graphs still looked comfortable, but the direct memory limit had already become the wall.
The operational point still stands:
The direct memory limit is separate from the heap usage graph.
If not configured, it can be tied to max heap by default.
Many deployments inherit that default because the option is not set.
Heap sizing and direct memory sizing still need to be reasoned about separately.
Imagine a Kafka-only broker on a 64 GiB server. If heap is set to 48 GiB, the page-cache problem is not the only issue. The default direct memory limit may also be tied to that heap size. JVM native memory, direct buffers, thread stacks, metaspace, page cache, and OS safety margin all compete inside the same physical memory budget.
The opposite mistake also exists. If heap is too small, Kafka’s internal objects, request handling, controller or broker state, and compression/decompression paths may suffer. The conclusion is not “make heap tiny.”
The conclusion is that heap is only one line in the memory budget.
And leaving direct memory unset does not make direct memory unlimited. The risk usually comes from forgetting that an unset value still has a JVM default.
Large Messages Increase Direct Memory Pressure
Direct memory issues become easier to expose when large messages are allowed.
In Kafka, enabling large messages usually means changing several producer, broker, consumer, and replication-related settings together. The Apache Kafka max.request.size producer setting limits the maximum request size a producer can send. Broker-side limits include message.max.bytes, socket.request.max.bytes, and replica.fetch.max.bytes.
Those settings do more than allow larger payloads. Larger record batches and larger requests can increase the size of buffers the broker needs to handle at once. Add concurrent connections, produce requests, fetch requests, replica fetches, TLS, and compression/decompression paths, and off-heap memory pressure can become visible.
The exact usage depends on workload, Kafka version, JDK version, network path, TLS, compression, and concurrency. It is not safe to reduce it to a simple formula like “message size times connection count.”
But the operating rule is clear:
The larger the messages and requests become, the riskier heap-only memory accounting becomes.Large messages should always be treated carefully in Kafka. In many systems, it is better to store the payload in object storage and send only a reference through Kafka. But if large record batches are unavoidable, direct and native memory budgets must be part of the sizing discussion.
Page Cache Still Matters
Talking about direct buffers does not reduce the importance of page cache.
Kafka brokers write log segments to disk and read them for consumers and follower replicas. OS page cache is central to that path. If heap pushes out page cache, disk I/O can increase and broker latency or throughput can wobble.
Direct memory is the third slot.
If heap is too large, page cache shrinks.
If only page cache is considered, direct/native memory limits are missed.
If direct memory is increased blindly, the whole OS memory budget can become unstable.
Kafka broker memory is not one number. It is a budget.
Kafka Heap Should Not Grow as a RAM Percentage
On a Kafka-only server, setting heap to a large percentage of total memory is usually not a good starting point.
Confluent’s production deployment documentation makes the same point. Kafka relies heavily on the filesystem and page cache, and it uses heap space carefully enough that the documentation says heap sizes do not need to be set above 6 GB. It also gives the example that this can leave up to 28-30 GB of filesystem cache on a 32 GB machine.
That guidance is very practical from the heap and page-cache perspective. But it does not make the direct buffer limit stand out as a separate sizing item. As a result, an operator can follow the idea of keeping heap small, still have physical memory available, and still hit OOM when large requests and direct buffer usage run into the JVM’s direct memory limit.
That guidance carries an important message:
Kafka heap should not keep growing with RAM size.
Even on larger broker machines, heap is usually kept small,
while the remaining memory is left for page cache and native/off-heap areas.
Adding direct buffers to the picture makes the reason clearer.
- Kafka needs heap, but it usually does not need a huge heap.
- OS page cache directly affects Kafka throughput and latency.
- Direct buffers and JVM native memory consume memory outside heap.
- The OS and filesystem need safety margin.
- In containers or cgroups, all of these compete inside the limit.
If -XX:MaxDirectMemorySize is not set and the direct memory limit follows max heap, increasing heap can also increase the possible direct memory limit. That does not mean the broker will always use that much direct memory. It means heap, direct memory, page cache, and OS headroom can compete inside the same physical memory boundary during bad moments.
So keeping Kafka broker heap small is not “giving Kafka less memory.”
It avoids putting all memory into heap,
and leaves room for page cache and direct/native memory.
What to Watch
Heap metrics alone are not enough.
Start with the JMX BufferPool metric for direct buffers:
java.nio:type=BufferPool,name=directUseful attributes include:
Count
MemoryUsed
TotalCapacity
These values help show how much direct buffer memory is being used. They do not explain all native memory, so they need to be read alongside RSS, cgroup memory, and OS available memory.
The MBean does not directly expose remaining direct memory. But it can be combined with MaxDirectMemorySize to calculate an operationally useful headroom estimate.
direct_used_bytes = BufferPool direct MemoryUsed
direct_limit_bytes = -XX:MaxDirectMemorySize
  or the JVM default when MaxDirectMemorySize is unset
direct_headroom_bytes = direct_limit_bytes - direct_used_bytes
direct_usage_ratio = direct_used_bytes / direct_limit_bytes
When MaxDirectMemorySize is not set, the effective limit can commonly be interpreted as the max heap value, as discussed earlier. This is not total JVM native-memory free space. It is direct-buffer-pool headroom.
When deeper inspection is possible, jcmd can help:
jcmd <pid> VM.native_memory summaryNative Memory Tracking needs to be enabled before it can provide useful details, and production overhead and policy need to be considered.
In container environments, check these together:
- container memory usage
- memory limit
- OOM kill events
- process RSS
- page cache accounting
- JVM heap and non-heap
- direct buffer pool JMX
- effective direct memory limit
- direct buffer headroom
The key is not to judge the broker from one heap graph.
The Operating Lesson
After this incident, my mental model for Kafka broker memory changed.
Before, I tended to think:
Kafka memory = heap + page cacheNow I think:
Kafka memory budget
  = heap
  + direct/native memory
  + thread/metaspace/code cache
  + page cache
  + OS safety margin
For clusters that allow large messages or large requests, direct buffer and native memory must be explicit items in the budget.
This is also why Konduo looks at broker-level metrics, host metrics, and JVM metrics together when observing Kafka resources. Operational causes rarely stay neatly inside one layer. Heap can look fine while process memory grows; OS memory can look available while the JVM reaches its direct memory limit. Those problems only make sense when the layers are viewed together.
The official sizing guidance is right to emphasize page cache. The operational addition is that direct buffer limits need to be added explicitly to the memory budget. Otherwise, the same question can return: “We kept heap small and left page cache room, so why did Kafka still OOM?”
Conclusion
In Kafka operations, saying “memory is still available” requires care.
OS available memory can remain while direct memory allocation fails. Heap usage can be low while off-heap direct buffers are the problem. Page cache can be considered, but the calculation can still be wrong if JVM native and direct memory are missing from the budget.
Kafka’s real memory use is not explained by heap and page cache alone.
Heap is not all of Kafka memory.
Page cache is not all of Kafka memory.
Direct buffers can quietly create failures between them.
When sizing a Kafka broker, a larger heap is not always safer. Especially on Kafka-only servers, it is usually safer to start from a small heap target such as the 6 GB guidance in Confluent’s documentation, then adjust only with evidence while observing direct buffers, native memory, page cache, and OS headroom together.
Further Reading
For more context connected to this topic, these posts are also worth reading.
- The Kafka Broker Slowed Down, but Kafka Was Not the Cause - Tracks a Kafka symptom down to storage path and I/O behavior.
- The Large Payload Kafka Handles Well, and the One It Should Not Carry - Explains the cost of sending large payloads directly through Kafka.
- JVM Metrics Alone Cannot Explain a Container - Explains why cgroup, filesystem, fd, and I/O signals matter beyond JVM metrics.