Engineering Note
The Kafka Partition Looks Fine, but the Disk Is Full
Kafka 4.3 adds Partition Size Percentage metrics for retention pressure, but Kafka operators still need physical free-space monitoring for log.dirs.
Free disk space on a Kafka broker is not an exciting metric.
But the story changes when an operations screen looks like this:
topic-a-0 RetentionSizeInPercent: 15%
topic-b-2 RetentionSizeInPercent: 18%
topic-c-1 RetentionSizeInPercent: 12%

/data/kafka-logs filesystem available: 3%
The individual partitions still look far from their retention limits. But the broker is almost out of physical disk space. What can stop the broker is not the low partition percentage; it is the remaining free space under log.dirs.
It is still one of the most practical Kafka operations signals. When the filesystem behind log.dirs fills up, Kafka stops feeling like an abstract messaging system. There are log segments to append, replicas to catch up, retention cleanup to run, and every one of those activities lands on a physical disk path.
Apache Kafka 4.3 added a useful metric family for this area:
KIP-1257: Partition Size Percentage Metrics for Storage MonitoringThese metrics are valuable. They show how close each partition is to its configured retention limit.
But they do not replace df -h, node exporter filesystem metrics, or cloud disk free-space alarms. If you operate Kafka, physical free space under log.dirs is not an optional nice-to-have signal; it is a metric that must be managed directly.
This post explains what the Kafka 4.3 partition size percentage metrics solve, what they do not solve, and why application tests with large messages must still watch physical free space under log.dirs.

log.dirs Is Kafka’s Physical Floor
Kafka topics are split into partitions, and each partition replica is stored as directories and segment files under a broker log directory. The Kafka documentation describes each sharded partition log as its own folder under the Kafka log directory.
That means operations need to look one level below topics.
topic
  -> partition
    -> replica
      -> broker
        -> log.dir
          -> filesystem free space
Kafka can manage retention, move replicas, and let consumers follow offsets, but the final write still lands on the filesystem behind log.dirs. When that layer fills up, the problem is not a vague performance issue. It is a write failure.
From Kafka’s point of view, disk full usually appears as No space left on device style IOException on paths such as log segment append, index append, checkpoint, or flush. The affected log directory becomes a failed storage path, and Kafka treats that directory as offline.
The result depends on the broker’s storage layout.
multiple log.dirs and only one fails:
  the broker may keep running on the remaining live log directories
  but replicas on the failed directory become offline
  and OfflineLogDirectoryCount becomes greater than 0

single log.dir, or all log.dirs fail:
  the broker has no live log directory left to write to
  and this leads to broker shutdown
In KRaft mode, there is one more detail to watch. If metadata.log.dir is not configured separately, the metadata log is placed in the first directory from log.dirs. So even with multiple log.dirs, filling the filesystem that also holds the metadata log can be more severe than losing one ordinary data log directory.
So disk full is not merely a state where the broker “may slow down.” It directly threatens broker or replica availability. Produce latency, follower lag, and slow reassignment can be early or surrounding symptoms, but once a log directory actually hits full, the cluster is already too late.
The New Partition Percentage Metrics in Kafka 4.3
KIP-1257, introduced in Kafka 4.3, exposes partition storage as a percentage of configured retention. Kafka already exposed partition size in bytes, but raw bytes do not directly answer: “How close is this partition to its retention limit?”
Imagine two topics:
| topic | partition size | retention.bytes | meaning |
|---|---|---|---|
small-events | 20 GiB | 100 GiB | 20% |
audit-archive | 20 GiB | 2 TiB | below 1% |
Both partitions are 20 GiB. Operationally, they are not the same. One is using 20% of its retention budget. The other still has much more room relative to its configured retention.
KIP-1257 makes that difference visible through JMX.
For non-tiered topics:
kafka.log:type=Log,name=RetentionSizeInPercent,topic=<topic>,partition=<partition>For tiered storage topics, remote log manager metrics are also available:
kafka.log.remote:type=RemoteLogManager,name=RetentionSizeInPercent,topic=<topic>,partition=<partition>
kafka.log.remote:type=RemoteLogManager,name=LocalRetentionSizeInPercent,topic=<topic>,partition=<partition>
LocalRetentionSizeInPercent is especially useful with tiered storage. Even when data is copied to remote storage, the broker’s local disk still carries hot data, active segments, local retention, and fetch paths.
The benefits are clear.
- Different topics can be compared by percentage even when their retention sizes differ.
- Partition granularity helps identify one partition growing abnormally.
- Tiered storage environments can distinguish total retention pressure from local retention pressure.
- Alert thresholds become more meaningful than raw byte thresholds alone.
For example, RetentionSizeInPercent > 80 is a useful signal that a partition is approaching its retention limit.
But This Is Not a Free-Space Metric
There is an important distinction.
RetentionSizeInPercent:
  partition size / configured retention limit

filesystem free space:
  remaining space on the actual filesystem behind log.dir
They answer different questions.
RetentionSizeInPercent asks, “How full is this partition relative to its retention policy?” log.dirs free space asks, “Can this broker still keep writing to the physical storage path?”
The second question is the survival question.
Consider this situation:
broker-1 /data/kafka-a:
  topic-a-0: 15% of retention.bytes
  topic-b-2: 18% of retention.bytes
  topic-c-1: 12% of retention.bytes
  ...
  filesystem available: 3%
Every individual partition percentage can look low. But if many partitions share the same log directory and retention.bytes is generous relative to actual disk capacity, physical free space can run out first.
The reverse can also happen.
topic-x-0:
  RetentionSizeInPercent = 95

filesystem available:
  45%
The partition is close to its retention limit, but the broker disk may still have room. That matters to the topic owner, but it may not mean the broker is about to hit disk full.
So these are complementary signals, not substitutes.
| Question | Signal to read |
|---|---|
| Is this partition close to its retention limit? | RetentionSizeInPercent |
| Is local tiered data close to its local retention limit? | LocalRetentionSizeInPercent |
| How large is this partition in absolute bytes? | kafka.log:type=Log,name=Size,... |
| Can this broker still write to the log directory? | filesystem available/free bytes |
| Has a log directory already gone offline? | LogDirectoryOffline |
Limits of the Percentage Metric
KIP-1257 gives operators a good signal, but it is risky to stretch it beyond its purpose.
First, it is a per-partition metric. It does not automatically show the sum of all partitions sharing the same disk. Operators still need to connect partition metrics back to broker, log directory, and filesystem signals.
Second, it is based on retention configuration. If retention.bytes or local.retention.bytes is much larger than real disk capacity, the percentage can stay low while the disk fills. Retention is an operating policy. Filesystem capacity is a physical constraint.
Third, unlimited retention or missing retention limits weaken the signal. KIP-1257 defines 0 for unlimited retention. That does not mean “no storage used”; it means there is no meaningful percentage denominator.
Fourth, cleanup is not instantaneous. The KIP explicitly allows values above 100% so operators can see retention lag or cleanup delays. Segments need to become eligible, cleanup needs to run, and active segments may not be removable yet.
Fifth, Kafka data may not be the only thing using the volume. OS logs, application logs, heap dumps, crash dumps, monitoring-agent spools, or backup residue can consume the same filesystem. Kafka partition percentage metrics do not see those bytes.
The short version:
Partition percentage shows retention pressure.
Physical free space shows broker survival headroom.
You need both.
How to Monitor Physical Free Space
Kafka disk monitoring should begin below topics and partitions. Physical free space under log.dirs is not a value to check only after an incident starts; it should be part of normal dashboards and alert policy.
At minimum, monitor these per log.dirs path:
- available bytes
- used percent
- free inode count
- write latency and device utilization
- rate of free-space consumption
kafka.log:type=LogManager,name=OfflineLogDirectoryCount
With Prometheus node exporter, that usually means watching node_filesystem_avail_bytes and node_filesystem_size_bytes for the mountpoints used by log.dirs. In cloud environments, also watch volume-level free space and write throttling. In container environments, verify which device backs each hostPath, PVC, or local PV.
This connects directly to an earlier post, JVM Metrics Alone Cannot Explain a Container. node-metrics-agent originally came from the need to operate JVM-based servers such as Kafka in containers, where JVM and broker JMX metrics alone cannot explain the filesystem and I/O environment around the process. If JMX exporter is already the standard collection path, the agent can bring filesystem signals for Kafka storage paths such as log.dirs into the same JMX/Prometheus flow.
So there is more than one useful path:
node_exporter:
  read mountpoint filesystems from the host or node perspective

node-metrics-agent:
  expose filesystem paths from the runtime environment around the Kafka JVM
On the node-metrics-agent path, configured Kafka storage paths appear as filesystem MBeans per path.
co.pletor.node:type=FsMetrics,path=/data/kafka-logsWith JMX exporter rules, that MBean can become Prometheus metrics in the same scrape flow as Kafka broker JMX, letting teams watch free space, utilization, inodes, and per-path filesystem status for /data/kafka-logs. The init-kafka-config --server-properties ... flow can generate filesystem path configuration from Kafka server.properties and its log.dirs, but the generated paths should still be checked against the real container mounts in the deployment environment.
Whichever path you choose, the core point is the same. A Kafka broker runs on the JVM, but heap, GC, and broker JMX are not enough. The mounted filesystem, cgroup boundary, and I/O path visible to the container can determine whether the broker can keep writing.
Do not rely on one percentage threshold.
absolute headroom:
  available bytes < 100 GiB

ratio:
  available percent < 15%

time to zero:
  current free space / recent consumption rate < 6 hours
The numbers must fit your environment. The point is to watch both “how much is left” and “how fast it is disappearing.” Kafka is a bursty system, so the dangerous days are often test days, replay days, and incident response days, not the calm days with slow growth.
Why Large Message Tests Are Especially Risky
Application tests with large Kafka messages deserve extra care.
Kafka can be configured to accept larger messages. You can raise producer max.request.size, topic max.message.bytes, consumer max.partition.fetch.bytes, and broker replication-related fetch limits so that record batches larger than the defaults can pass.
But large message tests can consume disk extremely quickly.
Suppose a test writes 100 MiB messages at 10 messages per second for 10 minutes.
100 MiB x 10 messages/sec x 600 sec = about 586 GiB
with replication factor 3 = about 1.7 TiB
If compression is worse than expected, producer retries create duplicates, multiple consumer groups store payloads downstream, or the test topic keeps production-like retention, the real pressure grows again.
RetentionSizeInPercent may still look low. The test topic may have a very large retention.bytes setting, or unlimited retention. Meanwhile, physical free space under log.dirs may be falling fast.
Common mistakes look like this:
- Raising message-size limits without recalculating disk budget.
- Forgetting to multiply by replication factor.
- Giving the test topic the same retention as production topics.
- Forgetting to delete the test topic or reduce retention after the test.
- Watching only cluster-wide capacity, not broker and log directory placement.
- Running
duordfonly after the test. - Stopping producers when consumers slow down, but leaving accumulated broker logs in place.
That kind of test starts as “Can the application send large messages?” and quietly becomes “How fast can this workload fill Kafka broker disks?”
Pre-Test Checklist
Before a large message test, calculate the disk budget first.
expected broker storage
  ~= message_size
   x message_count
   x replication_factor
   x retention_window_overlap
   x retry_or_duplicate_factor
   x overhead_margin
This is not an exact formula. It is a sanity check. It tells you whether the test is large enough to threaten broker storage.
The operating checklist should be practical.
- Use a dedicated test topic.
- Give the test topic short
retention.msor smallretention.bytes. - Monitor free bytes per
log.dirspath during the test. - Check broker-level partition placement and leader distribution.
- Define a stop condition, such as stopping immediately if any log directory drops below 20% free space.
- Prepare the cleanup step before the test starts: topic deletion or retention reduction.
- Verify with
dfthat cleanup actually recovered physical space.
If possible, run the test outside the production cluster. If not, at least require a separate topic, short retention, producer quota, and a clear stop condition.
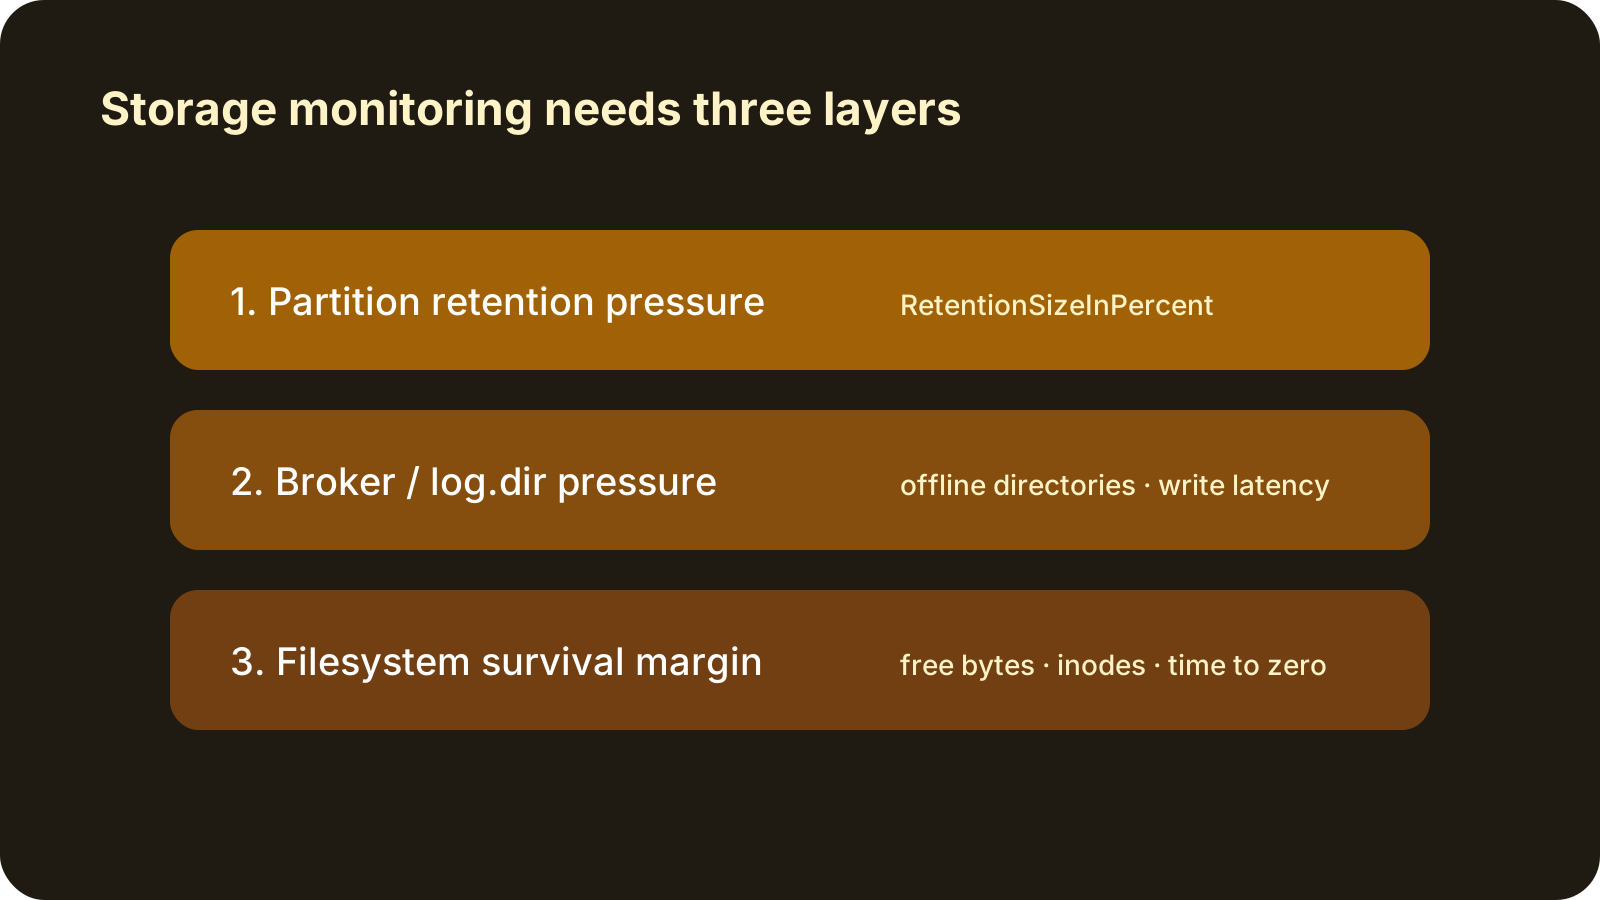
Monitor in Three Layers
Kafka storage monitoring is not one metric.
It is easier to think in three layers:
1. partition retention pressure
   - RetentionSizeInPercent
   - LocalRetentionSizeInPercent
   - Log Size

2. broker/log.dir physical pressure
   - filesystem available bytes
   - filesystem used percent
   - write latency
   - consumption rate to zero

3. Kafka symptom
   - produce latency
   - under-replicated partitions
   - ISR shrink
   - reassignment lag
   - LogDirectoryOffline
The first layer is useful for topic owners. The second layer is critical for platform operators. The third layer often means the problem is already close to user impact.
Good alerts read across layers.
RetentionSizeInPercent is high:
  review the topic retention policy.

log.dir free space is low:
  protect broker survival headroom.

both are bad:
  consider retention cleanup, partition movement, producer throttling, or stopping the test.
Kafka concepts such as brokers, topics, partitions, and consumer groups should be read as operational signals, not only as application concepts. This operational angle is also central to Konduo. Konduo connects cluster resources such as Kafka through plugins so teams can inspect status, metric evidence, diagnostics, and alert response in one operating flow. When Kafka partition metrics and host filesystem metrics need to be interpreted together, that cross-resource context matters.
Summary
Kafka 4.3’s Partition Size Percentage metrics are a welcome improvement. They make it much easier to see how close a partition is to its configured retention limit, especially when retention differs by topic or when tiered storage separates total retention from local retention.
But these metrics are not log.dirs free-space metrics.
The operational questions remain separate:
RetentionSizeInPercent:
  Is the partition close to its retention limit?

Filesystem free space:
  Does the broker still have physical space to keep writing?
That distinction matters even more during large message tests. A large message can pass once the settings are raised, but every byte that passes is written somewhere: broker logs, replicas, downstream storage, retry paths, or cleanup backlog. Disk budget is part of the test.
Partition percentage is a good map. The broker survives on the actual free space left under log.dirs. Treat physical free space as a first-class Kafka operations metric that must be managed directly.
Further Reading
For more context connected to this topic, these posts are also worth reading.
- The Large Payload Kafka Handles Well, and the One It Should Not Carry - Explains how large file payloads amplify across Kafka and downstream storage.
- A Kafka Broker Bottleneck Is Not Always Inside Kafka - Follows Kafka symptoms down into OS and storage-path signals.
- JVM Metrics Alone Cannot Explain a Container - Explains why cgroup, filesystem, fd, and I/O signals matter beyond JVM metrics.