Engineering Note
Run Konduo Community with Docker Compose in 10 Minutes
Start Konduo Community with Docker Compose, create the initial administrator, and verify metrics from the auto-registered resources.
Konduo is an integrated operations management platform for managing multiple operating targets in one workflow. It connects resources such as Redis, PostgreSQL, Kafka, etcd, MySQL, and MariaDB through plugins, so teams can inspect status, metric evidence, dashboards, and alert response in the same operating context.
The current Community resource and operations plugins cover Konduo self-observability, Host, Redis, Kafka, PostgreSQL, MySQL/MariaDB, etcd, Keycloak, Prometheus, Milvus, OpenSearch, and Synology. Alert delivery plugins include Email, Webhook, and Telegram channels. In other words, Konduo is closer to a common operations surface for registering, observing, and responding to many targets than to a single-system monitoring tool.
Konduo Community Edition is not a mock demo image. It is the product version where the Community feature set actually runs. Even in a local or PoC environment, you can register resources, connect metric sources, inspect dashboards, and configure alert rules and channels. The Community frontend, backend, and manual images are available under the pletorco namespace on Docker Hub, so Docker Compose is enough to start a basic stack with PostgreSQL, Prometheus, and the offline manual.
This quickstart runs five components with Docker Compose:
- Konduo frontend
- Konduo backend
- Konduo manual, optional
- PostgreSQL
- Prometheus
If you already operate Prometheus, you can connect your existing Prometheus instead. For a first local run, it is usually easier to include Prometheus in the same Compose stack. This post starts from that assumption.
The manual is optional too. This example includes the manual service so first-time users can open product documentation from the same origin as the UI. If you already use an external documentation site or do not want to deploy the manual, remove the manual service and leave KONDUO_MANUAL_URL empty.

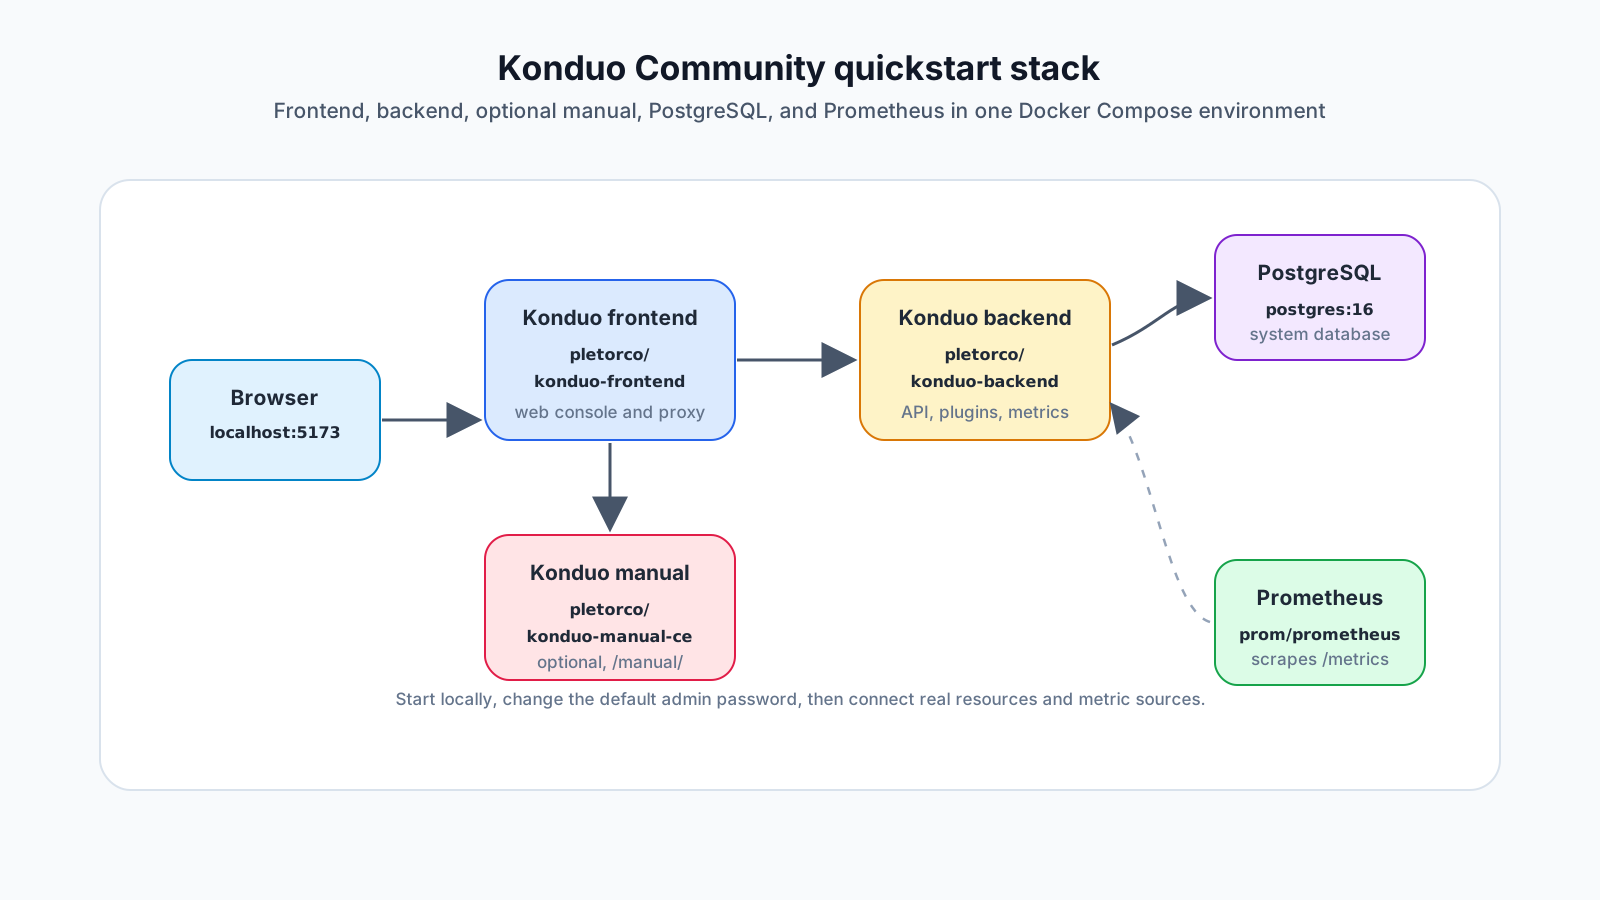
The short version
For a local first run, the flow is simple:
- Pull
pletorco/konduo-frontend,pletorco/konduo-backend, andpletorco/konduo-manual-cefrom Docker Hub. - Run PostgreSQL for Konduo system data.
- Run Prometheus as the metric storage and query layer, with its remote write receiver enabled.
- Optionally run the manual image and let the frontend Caddy server proxy it under
/manual/. - Create the initial administrator from the server terminal.
- Open
http://localhost:5173in your browser. - Sign in with the administrator you created and change the initial password.
- Confirm the auto-registered Konduo and PostgreSQL resources.
- Register a Prometheus metric source, connect it to both resources, and verify dashboard metrics.
This setup is suitable for local validation, PoC, and fast product exploration, but it is not just a static demo. The real Community backend and frontend run. On the first start with a new database, Konduo automatically registers its self-observability resource and the PostgreSQL resource used as its main database. Registering and linking a Prometheus metric source is enough to verify the flow where Konduo collects metrics from both resources and writes them to Prometheus. For production, review TLS, backup, external PostgreSQL, image tag or digest pinning, secret handling, and network exposure separately.
Prerequisites
You need Docker and Docker Compose.
docker version
docker compose version
This post uses the public Docker Hub images:
pletorco/konduo-backend:latest
pletorco/konduo-frontend:latest
pletorco/konduo-manual-ce:latest
As of June 30, 2026, Docker Hub provides latest tags for the Community backend, frontend, and manual CE images. latest is convenient for quick exploration, but version tags or digest pinning are better for repeatable validation and pre-production tests.
Create a working directory
Create a working directory first.
mkdir -p konduo-quickstart/prometheus
cd konduo-quickstart
This directory will contain .env, compose.yml, and prometheus/prometheus.yml.
Prepare secrets
KONDUO_SECRET_KEY is used to encrypt stored secrets such as resource configuration and credentials. Generate it once and keep it stable across container restarts and upgrades.
openssl rand -hex 32Generate a separate JWT_SECRET too.
openssl rand -hex 32Write .env
Create .env.
GO_ENV=development

DB_NAME=konduo
DB_USER=konduo
DB_PASSWORD=change-this-db-password
DB_SSLMODE=disable

JWT_SECRET=change-this-jwt-secret
KONDUO_SECRET_KEY=replace-with-openssl-rand-hex-32
KONDUO_ALERT_INSTANCE_LABEL=QUICKSTART CE
KONDUO_PUBLIC_URL=

BACKEND_IMAGE_REF=pletorco/konduo-backend:latest
FRONTEND_IMAGE_REF=pletorco/konduo-frontend:latest
MANUAL_IMAGE_REF=pletorco/konduo-manual-ce:latest

KONDUO_MANUAL_URL=/manual/
MANUAL_UPSTREAM=manual:8080
MANUAL_PORT=8088
Replace DB_PASSWORD, JWT_SECRET, and KONDUO_SECRET_KEY with your own generated values.
Add Prometheus configuration
If you do not already have Prometheus, run it with the Compose stack. In this quickstart, Prometheus is the storage and query layer for metrics collected directly by Konduo. For the PostgreSQL and Konduo self-observability resources, Konduo collects the metrics and sends them through the Prometheus remote write API instead of requiring Prometheus to scrape separate exporters.
The base prometheus.yml therefore needs no scrape targets. Prometheus must instead accept remote write requests, so add --web.enable-remote-write-receiver to its command-line arguments. The Compose example below already includes this flag.
prometheus/prometheus.yml:
global:
  scrape_interval: 15s

scrape_configs: []
The empty scrape_configs is intentional. Konduo collects the PostgreSQL and self-observability metrics in this exercise, so neither system needs to be added as a Prometheus scrape target. Add scrape jobs later only for other systems whose exporters Prometheus will collect directly.
If you already operate Prometheus, you can omit the Compose Prometheus service and connect the existing server as the metric source. The Konduo backend must be able to reach both its query and remote write APIs, and the remote write receiver must be enabled.
Write compose.yml
The following compose.yml runs frontend, backend, optional manual, PostgreSQL, and Prometheus together. If you do not need the manual, remove the manual service and the frontend MANUAL_UPSTREAM setting, then leave KONDUO_MANUAL_URL empty in .env.
services:
  backend:
    image: ${BACKEND_IMAGE_REF}
    environment:
      GO_ENV: ${GO_ENV:-development}
      PORT: "8080"
      PLUGIN_PACKAGE_DIR: /app/data/plugins
      AUTO_GENERATE_ENV: "true"
      DB_TYPE: postgres
      DB_HOST: postgres
      DB_PORT: "5432"
      DB_NAME: ${DB_NAME:-konduo}
      DB_USER: ${DB_USER:-konduo}
      DB_PASSWORD: ${DB_PASSWORD}
      DB_SSLMODE: ${DB_SSLMODE:-disable}
      JWT_SECRET: ${JWT_SECRET}
      KONDUO_SECRET_KEY: ${KONDUO_SECRET_KEY}
      KONDUO_ALERT_INSTANCE_LABEL: ${KONDUO_ALERT_INSTANCE_LABEL:-}
      KONDUO_PUBLIC_URL: ${KONDUO_PUBLIC_URL:-}
    ports:
      - "8080:8080"
    volumes:
      - konduo_data:/data
    depends_on:
      postgres:
        condition: service_healthy
    restart: unless-stopped

  frontend:
    image: ${FRONTEND_IMAGE_REF}
    environment:
      BACKEND_UPSTREAM: backend:8080
      KONDUO_MANUAL_URL: ${KONDUO_MANUAL_URL-/manual/}
      MANUAL_UPSTREAM: ${MANUAL_UPSTREAM-manual:8080}
      KONDUO_FRONTEND_PORT: "8080"
    depends_on:
      - backend
    ports:
      - "5173:8080"
    restart: unless-stopped

  manual:
    image: ${MANUAL_IMAGE_REF}
    ports:
      - "${MANUAL_PORT:-8088}:8080"
    restart: unless-stopped

  postgres:
    image: postgres:16-alpine
    shm_size: "256mb"
    environment:
      POSTGRES_DB: ${DB_NAME:-konduo}
      POSTGRES_USER: ${DB_USER:-konduo}
      POSTGRES_PASSWORD: ${DB_PASSWORD}
    ports:
      - "5432:5432"
    volumes:
      - konduo_postgres_data:/var/lib/postgresql/data
    healthcheck:
      test: ["CMD-SHELL", "pg_isready -U ${DB_USER:-konduo} -d ${DB_NAME:-konduo}"]
      interval: 10s
      timeout: 5s
      retries: 10
    restart: unless-stopped

  prometheus:
    image: prom/prometheus:v3.5.4
    command:
      - --config.file=/etc/prometheus/prometheus.yml
      - --storage.tsdb.path=/prometheus
      - --web.enable-remote-write-receiver
    volumes:
      - ./prometheus/prometheus.yml:/etc/prometheus/prometheus.yml:ro
      - prometheus_data:/prometheus
    ports:
      - "9090:9090"
    depends_on:
      - backend
    restart: unless-stopped

volumes:
  konduo_data:
  konduo_postgres_data:
  prometheus_data:
The current frontend image uses Caddy as its web server. Set the container’s listening port with KONDUO_FRONTEND_PORT; the NGINX_PORT variable used by earlier images is no longer supported. The example maps host port 5173 to container port 8080, so the browser URL remains http://localhost:5173.
Start the stack
Pull the images and start the stack.
docker compose --env-file .env -f compose.yml pull
docker compose --env-file .env -f compose.yml up -d
docker compose --env-file .env -f compose.yml ps
Use this command to follow backend logs:
docker compose --env-file .env -f compose.yml logs -f backendVerify access
Open the frontend in your browser.
http://localhost:5173Check backend status with:
curl http://localhost:8080/api/v1/system/version
curl http://localhost:8080/metrics
Open Prometheus at:
http://localhost:9090Check that Prometheus is ready to accept requests:
curl -fsS http://localhost:9090/-/readyIt is normal for Status > Targets to be empty in this example. Prometheus does not pull PostgreSQL or Konduo self-observability metrics; Konduo collects and sends them through remote write.
When included, the manual is served by the frontend Caddy server under the same-origin /manual/ path.
curl -fsS http://localhost:5173/runtime-config.json
curl -fsS http://localhost:5173/manual/manual-build.json
Open it in a browser:
http://localhost:5173/manual/You can also check the directly exposed manual service port:
http://localhost:8088When the UI language is Korean or English, the top-bar Manual link opens the matching language path. If you deploy without the manual service, set an empty value such as KONDUO_MANUAL_URL= in .env to hide the link.
Create the initial administrator and sign in
A fresh Konduo installation does not create an administrator account or default password automatically. Before opening the UI, create the initial administrator on the server running the Compose stack.
Open a Bash terminal in the directory containing compose.yml and .env, then check the current bootstrap state. Run this command from the server terminal, not from a browser or a shell inside the container. The backend and PostgreSQL must already be running.
docker compose --env-file .env -f compose.yml exec -T backend \
  /app/konduo-backend admin-bootstrap-status
If the state is setup_required, create the initial administrator. This example uses admin; change --username if you prefer another username. The password remains hidden while you type and is passed to the container through standard input.
read -rsp 'Initial administrator password: ' INITIAL_ADMIN_PASSWORD
echo
printf '%s\n' "$INITIAL_ADMIN_PASSWORD" |
  docker compose --env-file .env -f compose.yml exec -T backend \
    /app/konduo-backend admin-bootstrap --username admin --password-stdin
unset INITIAL_ADMIN_PASSWORD
The password must satisfy the current authentication policy. INITIAL_ADMIN_PASSWORD is a temporary shell variable used only by this command. Adding it to .env does not create an account.
Run admin-bootstrap-status again and confirm that the state is complete. If it is already complete, use the existing administrator account; running bootstrap again does not change its password. recovery_required means that bootstrap finished but no active administrator remains. Follow the operator account-recovery procedure instead of resetting the database or trying to overwrite an account with bootstrap.
You can now sign in:
- Open
http://localhost:5173. - Sign in with the username you created and the initial password entered above.
- On the first password-change screen, enter the initial password as the current password.
- Enter and confirm a new administrator password.
- Save the change and log out.
- Confirm that you can sign in again with the new password.
Create the administrator and complete the first password change before opening the service to external users. The backend readiness check (/readyz) may fail until the initial administrator exists.
Verify the first metrics from auto-registered resources
When Konduo starts for the first time with a new database, it automatically registers these resources:
- The Konduo self-observability resource
- The PostgreSQL resource used as Konduo’s main database
You do not need to create either resource for this exercise. Register and link a Prometheus metric source to try the direct collection flow immediately.
- Open
Settingsfrom the top navigation and selectMetric Sources. - Add a Prometheus metric source.
- Use a recognizable name such as
Prometheus. - Set the URL to
http://prometheus:9090, which is reachable from the backend container. Do not use the browser URL,http://localhost:9090, here. - Run the connection test and save the metric source.
- Open the resource list and confirm that the Konduo and PostgreSQL resources are present.
- In each resource’s metric settings, link the Prometheus metric source and save the change.
- Confirm that collection is healthy, then open each resource dashboard and inspect its metrics.
Prometheus is not optional in this flow. What you can omit is the Prometheus scrape-target configuration for PostgreSQL and Konduo. Konduo collects their metrics and writes them to Prometheus, while dashboards and alert rules query the stored time series from Prometheus.
Next steps
After verifying the first metrics, connect the other targets that Konduo will observe and operate.
- Use the manual for installation and operations workflows if you include it.
- Add resources such as Redis, Kafka, MySQL/MariaDB, etcd, Keycloak, Milvus, OpenSearch, Synology, or Host.
- For resources with direct collection support, link the Prometheus metric source. For other resources, add the required exporter and Prometheus scrape job.
- Check dashboards and alert rules.
- Connect Email, Webhook, or Telegram alert channels.
- Use version tags or digest pinning for operational validation.
The important point is that Konduo is not just a collection of links to different systems. Its product direction is to keep resource status, Prometheus-backed metrics, dashboards, alert rules, alert channels, operating permissions, and history in one workflow. The Docker Compose quickstart is not a limited demo; it is the smallest practical way to see that real flow locally.
Checklist
Before calling the quickstart complete, check:
- Are you using
pletorco/konduo-backendandpletorco/konduo-frontend? - If you include the manual, are you using
pletorco/konduo-manual-ce? - Did you generate and keep a stable
KONDUO_SECRET_KEY? - Is the PostgreSQL volume persistent?
- Is Prometheus running with
--web.enable-remote-write-receiver? - Are the auto-registered Konduo and PostgreSQL resources visible?
- Is the Prometheus metric source linked to both resources?
- Did you confirm healthy collection and dashboard metrics for both resources?
- If you include the manual, does
http://localhost:5173/manual/open it? - Does
admin-bootstrap-statusreportcomplete? - Did you sign in with the administrator you created and complete the first password change?
- Before external exposure, did you review TLS, firewall, backup, and tag pinning?
The goal of the quickstart is not a perfect production topology. It is to make the product flow visible quickly. Once that is clear, strengthen persistence, security, and deployment boundaries for your real environment.
Further Reading
For more context connected to this topic, these posts are also worth reading.
- From Env to Config: The Last Mile of Container Configuration - Covers the pattern of turning container environment variables into real config files.
- Docker Compose Is Convenient. Plain .env Secrets Are Not. - Introduces a way to reduce plaintext secret files in Compose workflows.
- JVM Metrics Alone Cannot Explain a Container - Explains why cgroup, filesystem, fd, and I/O signals matter beyond JVM metrics.