Engineering Note
When Logging Becomes the Bottleneck: Keeping Heavy Appender Work Off the Request Path
A practical guide to Log4j2 Custom Appenders through hot-path protection, bounded queues, AsyncAppender, throttling, and operational trade-offs.
Logs help us understand what happened. Sometimes the code that writes logs becomes the thing that causes trouble.
Imagine an order API getting slower. The database is fine. The payment provider is fine. The real reason is that a log Appender is waiting for a collector over the network. Logging was supposed to support observability, but it became a new bottleneck on the request path.
This post looks at Log4j2 Custom Appenders from that angle: not just how to implement one, but how to keep one from slowing down the application.

The short version
If you only remember a few things, keep these:
- Do not perform network I/O in
append(). - Always use a bounded queue.
- Decide what happens when the queue is full: block, drop, or fail over.
- Throttle drop and failure reports.
AsyncAppenderis useful, but it does not magically make a slow Appender harmless.
A Custom Appender is less about “where do logs go?” and more about “how do we keep logging from hurting the service?”
Where an Appender sits
In Log4j2, an Appender delivers log events to a destination. Console output, file writes, HTTP delivery, Kafka publishing, and database logging all happen through appenders.
The simplified flow looks like this:
application code
  -> Logger
  -> LoggerConfig
  -> Filter
  -> AppenderRef
  -> Appender.append(LogEvent)
  -> destination
Most custom appenders extend AbstractAppender instead of implementing Appender directly. It already provides common behavior such as name, filter, layout, and lifecycle handling.
The important part is where append(LogEvent event) runs. It is close to the application’s logging call path. Slow work here can make the caller slow too.
Keep the hot path clear
It helps to first decide what must not happen inside append():
- HTTP requests
- database inserts
- waiting for Kafka send acknowledgements
- DNS lookup
- long retry loops
- synchronous compression
- complex JSON transformation
- repeated filesystem checks
- calling application loggers again from inside the Appender
Logging calls are scattered throughout the codebase. If one Appender gets slow, it can affect service-wide tail latency rather than a single endpoint.
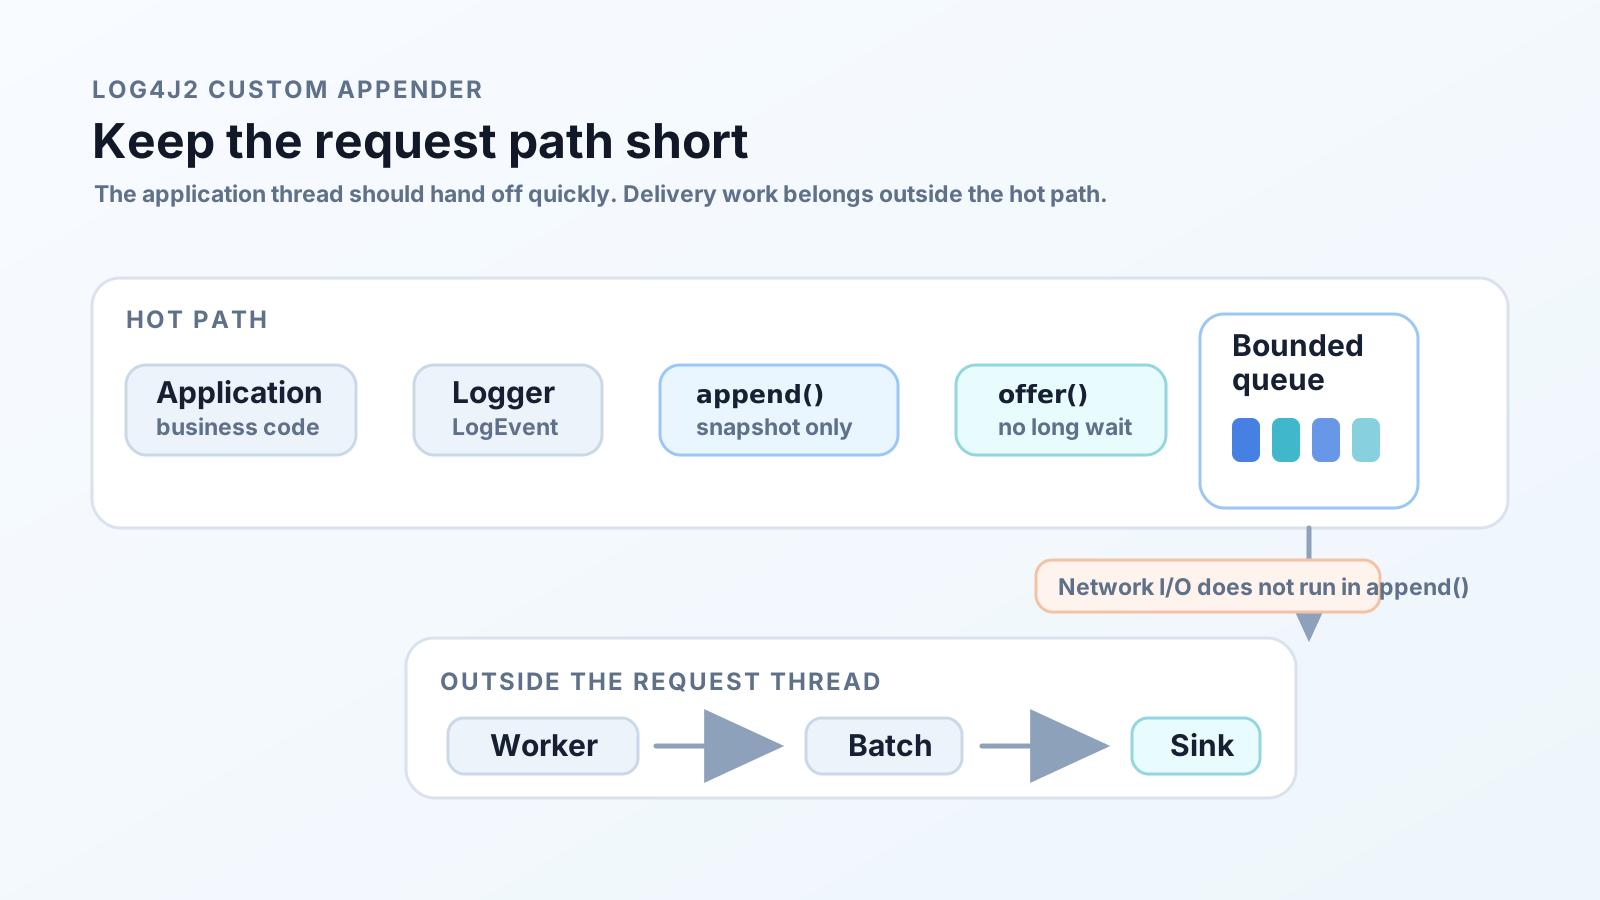
A good append() usually does only this:
check started state
snapshot the required data
offer to a bounded queue
increase drop count if the offer fails
occasionally report status
The word offer matters. A call that waits for a long time, such as an unbounded put, does not fit a hot-path protection design.
A simple shape for operational logs
For ordinary operational logs, the basic structure can be:
Appender.append()
  -> bounded queue offer
  -> worker thread
  -> batch
  -> external sink
The core of the Appender can stay small:
@Plugin(
    name = "Telemetry",
    category = Node.CATEGORY,
    elementType = Appender.ELEMENT_TYPE,
    printObject = true
)
public final class TelemetryAppender extends AbstractAppender {
    private static final StatusLogger STATUS = StatusLogger.getLogger();

    private final BlockingQueue<LogEvent> queue;
    private final AtomicLong dropped = new AtomicLong();
    private final AtomicLong nextDropReportAt = new AtomicLong();
    private final long dropReportIntervalNanos;

    private TelemetryAppender(
        String name,
        Filter filter,
        Layout<? extends Serializable> layout,
        boolean ignoreExceptions,
        int queueCapacity,
        long dropReportIntervalMillis
    ) {
        super(name, filter, layout, ignoreExceptions, Property.EMPTY_ARRAY);
        this.queue = new ArrayBlockingQueue<>(queueCapacity);
        this.dropReportIntervalNanos = TimeUnit.MILLISECONDS.toNanos(dropReportIntervalMillis);
    }

    @Override
    public void append(LogEvent event) {
        if (!isStarted()) {
            return;
        }

        LogEvent snapshot = event.toImmutable();
        if (!queue.offer(snapshot)) {
            reportDropIfNeeded(dropped.incrementAndGet());
        }
    }

    private void reportDropIfNeeded(long droppedNow) {
        long now = System.nanoTime();
        long next = nextDropReportAt.get();

        if (now >= next && nextDropReportAt.compareAndSet(next, now + dropReportIntervalNanos)) {
            STATUS.warn("TelemetryAppender queue is full; dropped {} events", droppedNow);
        }
    }
}
A production version still needs a worker, batching, delivery timeouts, shutdown draining, and metrics. The direction stays the same: keep append() thin and move heavy work out.
Copy the event before handing it off
If another thread will read the event later, consider taking a snapshot with event.toImmutable(). Log4j2 supports asynchronous logging and event reuse optimizations, so reading the original LogEvent later from another thread can become unsafe.
Another option is to extract only the fields the worker needs:
record LogRecord(
    long timestampMillis,
    String level,
    String loggerName,
    String message,
    String thrown
) {}
This makes costs easier to reason about. But be careful: if you do too much string conversion inside append(), the hot-path cost comes back.
The real design starts when the queue is full
Most appenders look fine when everything is healthy. The difference appears during failure.
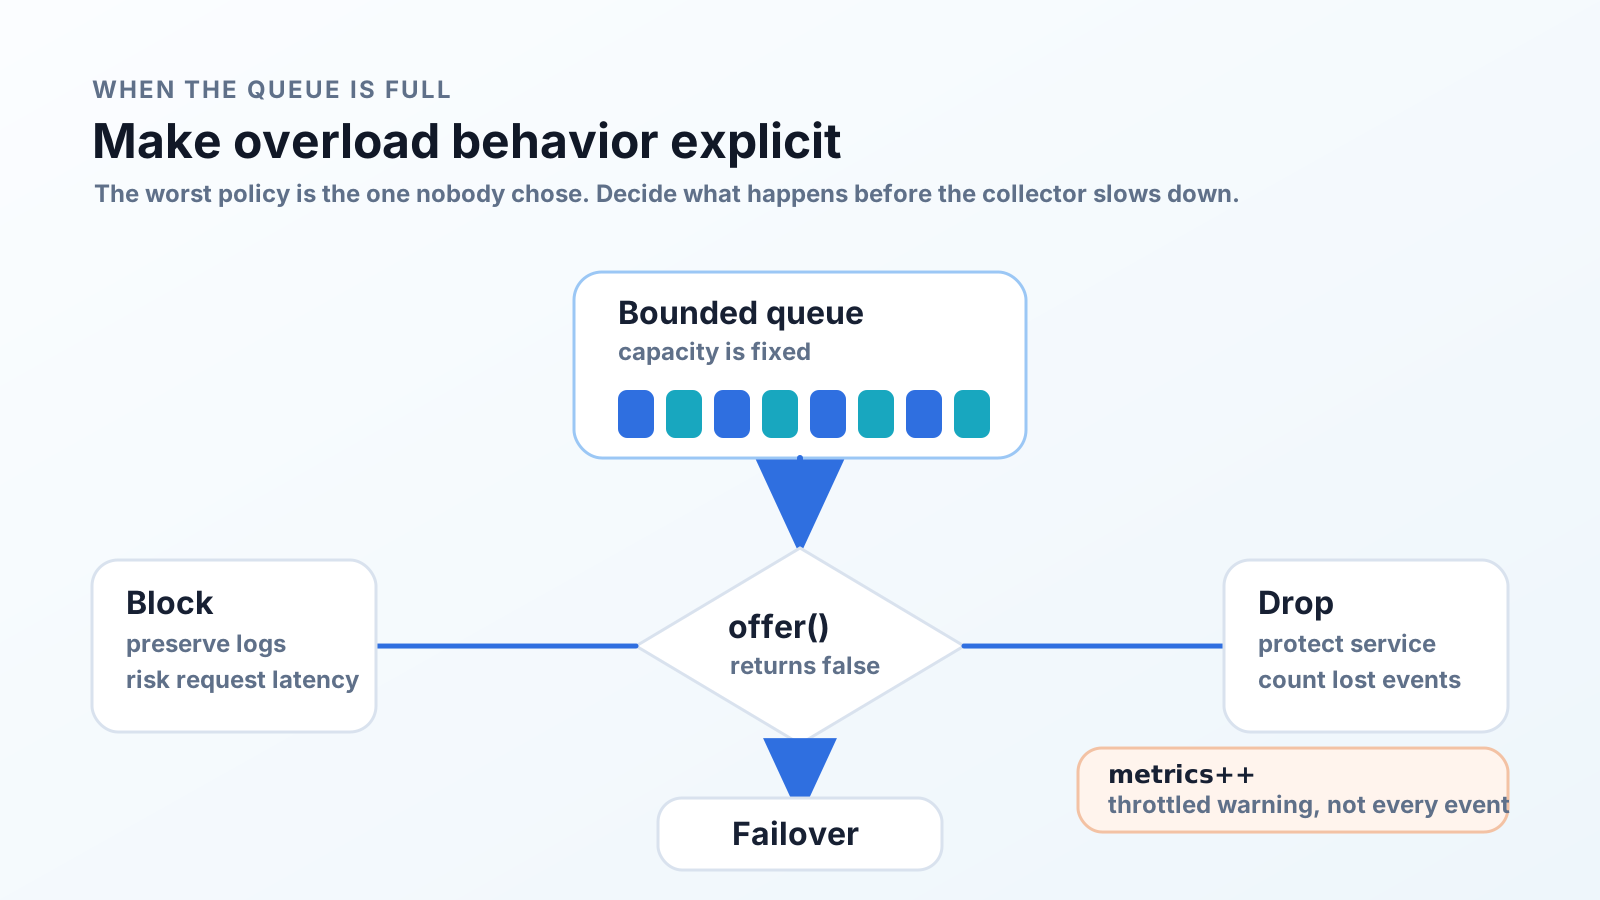
When the collector slows down and the queue fills, there are three common choices:
| Policy | Benefit | Risk |
|---|---|---|
| block | fewer lost events | request threads can stop |
| drop | protects the application | logs disappear |
| failover | can use another route | more operational complexity |
For ordinary operational logs, drop + counter + throttled warning is often the most predictable model. For audit logs or payment evidence where loss is a business problem, this is the wrong primary model. Consider an outbox, transactional storage, or synchronous failover first.
Throttling is a safety feature
What happens if the Appender logs a warning every time the queue is full?
The queue is full because there are too many logs. Then the Appender creates more logs about the full queue. Those logs go through logging again. The warning meant to explain the problem can make the problem worse.
Appender status reporting should be limited:
report at most once every few seconds
include accumulated drop count
do not call application loggers internally
prefer metrics counters where possible
Delivery failure warnings need the same care. Printing a stack trace for every failed batch can be expensive and noisy during an outage.
Can AsyncAppender solve this?
Log4j2 provides the Async Appender. You can put it in front of a custom Appender:
Application thread
  -> Logger
  -> AsyncAppender queue offer
  -> background thread
  -> TelemetryAppender.append()
  -> external sink
The XML configuration looks like this:
<Appenders>
  <Telemetry
      name="Telemetry"
      queueCapacity="8192"
      dropReportIntervalMillis="10000"
      ignoreExceptions="true">
    <PatternLayout pattern="%d{ISO8601} %-5level [%t] %logger - %msg%n%throwable"/>
  </Telemetry>

  <Async
      name="AsyncTelemetry"
      bufferSize="8192"
      blocking="false"
      shutdownTimeout="5000"
      includeLocation="false">
    <AppenderRef ref="Telemetry"/>
  </Async>
</Appenders>

<Loggers>
  <Root level="INFO" includeLocation="false">
    <AppenderRef ref="AsyncTelemetry" level="WARN"/>
  </Root>
</Loggers>
And the YAML version:
Configuration:
  status: WARN

  Appenders:
    Telemetry:
      name: Telemetry
      queueCapacity: 8192
      dropReportIntervalMillis: 10000
      ignoreExceptions: true
      PatternLayout:
        pattern: "%d{ISO8601} %-5level [%t] %logger - %msg%n%throwable"

    Async:
      name: AsyncTelemetry
      bufferSize: 8192
      blocking: false
      shutdownTimeout: 5000
      includeLocation: false
      AppenderRef:
        ref: Telemetry

  Loggers:
    Root:
      level: INFO
      includeLocation: false
      AppenderRef:
        ref: AsyncTelemetry
        level: WARN
The important attribute is blocking. The Async Appender can wait when its queue is full. If the goal is hot-path protection, consider blocking="false". That can route events to errorRef or lose them depending on configuration, so the policy must match operational requirements.
Should you use both AsyncAppender and an internal queue in the custom Appender?
Usually, choose one first:
- Need a simple separation from the caller thread: wrap with
AsyncAppender. - Need precise control over drop, batching, retry, and metrics: keep a bounded queue inside the custom Appender.
- Need both: accept that it is a double-queue design and define latency, drop location, shutdown drain, and metrics semantics explicitly.
The plugin registration trap
To use <Telemetry> in a Log4j2 configuration file, Log4j must discover the Appender as a plugin.
That means:
- Add
@Pluginto the class. - Run the annotation processor at build time so
Log4j2Plugins.datis generated.
Maven example:
<plugin>
  <groupId>org.apache.maven.plugins</groupId>
  <artifactId>maven-compiler-plugin</artifactId>
  <configuration>
    <annotationProcessorPaths>
      <path>
        <groupId>org.apache.logging.log4j</groupId>
        <artifactId>log4j-core</artifactId>
        <version>${log4j2.version}</version>
      </path>
    </annotationProcessorPaths>
    <annotationProcessors>
      <processor>org.apache.logging.log4j.core.config.plugins.processor.PluginProcessor</processor>
    </annotationProcessors>
  </configuration>
</plugin>
Gradle example:
dependencies {
    implementation("org.apache.logging.log4j:log4j-api:${log4j2Version}")
    implementation("org.apache.logging.log4j:log4j-core:${log4j2Version}")
    annotationProcessor("org.apache.logging.log4j:log4j-core:${log4j2Version}")
}
If you use YAML configuration, a YAML parser must also be present on the runtime classpath. A common choice is com.fasterxml.jackson.dataformat:jackson-dataformat-yaml.
Final checklist
Before shipping a custom Appender, answer these:
- Does
append()avoid external I/O? - Is the queue bounded?
- What happens when the queue is full: block, drop, or failover?
- Can dropped event count be observed through metrics?
- Are drop and delivery failure warnings throttled?
- Does the Appender avoid calling application loggers internally?
- What happens to queued events during shutdown?
- Are external client timeouts short and explicit?
- Are retries bounded?
- Is
includeLocationreally necessary? - Does
ignoreExceptionsmatch the business importance of the log?
Closing
A Custom Appender is a place to limit responsibility, not just add behavior.
A good Appender protects the application under failure. It accepts quickly, uses a bounded queue, follows a clear policy when overloaded, and reports the situation through metrics and throttled warnings.
Konduo treats logs, metrics, and alerts as connected operational evidence rather than isolated signals. It connects infrastructure status, metric and log evidence, and alert response into one operating flow so teams can understand issues without rebuilding context across tools.
Logs should be a window into the service. The service should not stop because it is busy cleaning that window.
References
- Apache Log4j Appenders
- Apache Log4j Delegating Appenders
- Apache Log4j Plugins
- Apache Log4j Asynchronous Loggers
- Apache Log4j Configuration
Further Reading
For more context connected to this topic, these posts are also worth reading.
- Why Turn Immutable YAML Logs into Full Objects? - Looks at filtering immutable logs without building full object trees.
- JVM Metrics Alone Cannot Explain a Container - Explains why cgroup, filesystem, fd, and I/O signals matter beyond JVM metrics.
- Consumer Lag Is Not a Health Score: Thinking in Kafka Consuming Pressure - Reframes consumer lag as processing pressure.