Engineering Note
Trace Should Not Break When Kafka Is in the Middle
When Kafka sits inside an MSA flow, tracing does not continue automatically like synchronous HTTP calls. This post explains how to propagate trace context through Kafka headers and how to think about producer and consumer instrumentation.
In an MSA or distributed system, one user request often passes through several services.
API Gateway
-> Order Service
-> Kafka
-> Payment Worker
-> External Payment API
-> Kafka
-> Notification Worker
When the flow is mostly HTTP, APM and tracing agents can usually connect the dots naturally. An inbound HTTP request creates a span, the outbound HTTP request carries trace context, and the next service continues the trace.
Kafka changes that shape.
Kafka does not call the next service directly. A producer writes a message to a topic, and a consumer reads it later. The call stack is broken. Time may pass. From the producer’s point of view, the send completed. From the consumer’s point of view, a record appeared in a poll result.
So when Kafka sits in the middle of a distributed flow, the first question is not which tracing backend to use.
The first question is:
How do we preserve trace context across the message boundary?The essence of Kafka tracing is not attaching a specific APM product. It is preserving trace context across a message boundary.

The Core Is Trace Context, Not Jaeger
Jaeger is a useful tracing backend. Grafana Tempo, Zipkin, Datadog APM, New Relic, Honeycomb, and others can play a similar role.
But when designing tracing across Kafka, Jaeger itself is not the core. The core is making sure the producer injects the current trace context into the Kafka record, and the consumer extracts that context to continue the next span as a parent or a link.
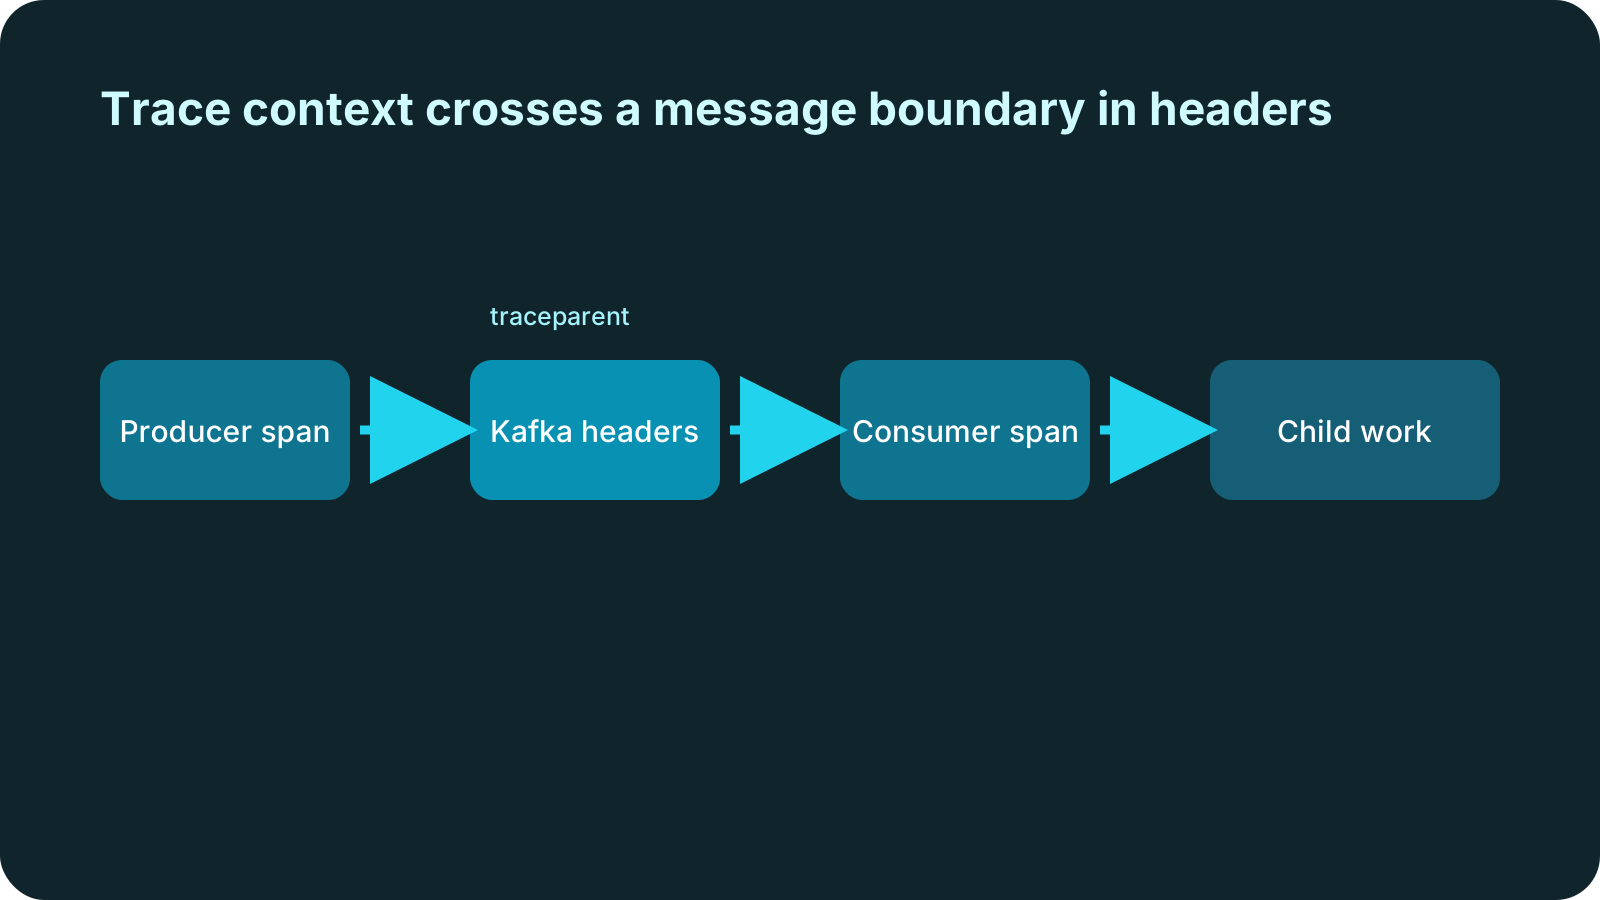
The OpenTelemetry context propagation documentation explains that the default propagator uses W3C Trace Context headers. In HTTP, those values usually move as traceparent and tracestate headers.
Kafka does not have HTTP headers. It has record headers.
Kafka record
  key
  value
  headers
    traceparent
    tracestate
If this structure is preserved, the tracing backend becomes a later decision. Whether traces are stored in Jaeger, Tempo, Zipkin, or a vendor APM, the consumer-side work can only be connected when trace context travels with the record.
Jaeger also fits more naturally into this OpenTelemetry-centered model now. The Jaeger migration to OpenTelemetry SDK documentation says native Jaeger clients were retired and recommends OpenTelemetry APIs, SDKs, and instrumentation for new applications. Jaeger can also receive trace data through OTLP.
So the durable architecture is simple: use OpenTelemetry to propagate context and create spans in applications, and choose Jaeger or another backend to store and query the resulting traces.
Kafka Is a Message Boundary, Not That Kind of Transaction Boundary
The phrase “Kafka transaction tracing” needs care.
Kafka already has a transaction feature. It is tied to transactional.id, idempotent producers, and exactly-once processing. That is not the meaning of transaction in this post.
What we want to observe is this:
A user payment request passed through
which HTTP services, Kafka topics, and consumers,
and where it slowed down or failed.
That is a distributed trace problem, not a Kafka transaction semantics problem.
Kafka creates a message boundary rather than a synchronous call boundary. The producer and consumer may not run at the same time. A message may be retried, moved to a DLQ, or reprocessed later.
That means Kafka tracing cannot always be reduced to “make the consumer span a child of the producer span.” For the common happy path, parent-child relationships are often useful. For batch, retry, DLQ, and reprocessing flows, span links or separate traces may be more accurate.
What the Producer Should Do
Producer instrumentation has two jobs.
First, record the Kafka send as a span.
Second, inject the current trace context into the Kafka record headers.
Conceptually, the code looks like this:
ProducerRecord<String, byte[]> record =
    new ProducerRecord<>("payments.requested", key, payload);

Context current = Context.current();

openTelemetry.getPropagators()
    .getTextMapPropagator()
    .inject(current, record.headers(), KafkaHeaderSetter.INSTANCE);

producer.send(record);
In production, this logic should not be handwritten in every service. If each service uses slightly different header names, span attributes, error handling, or sampling behavior, traces become noisy and unreliable.
Teams usually choose one of these paths:
- Use auto-instrumentation such as the OpenTelemetry Java Agent.
- Use explicit OpenTelemetry Kafka clients library instrumentation.
- Build an internal producer wrapper and standardize context injection there.
The OpenTelemetry Java agent attaches to a Java application and captures telemetry from many common libraries. The official supported libraries list includes Kafka-related instrumentation.
If you need more explicit control, opentelemetry-kafka-clients-2.6 is worth reviewing. It requires more application or client configuration, but it can fit well when building a common wrapper.
Producer spans commonly include:
- topic
- client id
- partition, when known
- key existence or key hash
- record size, when useful
- send latency
- error type
Be careful with keys and payloads. Traces are not a payload archive. They are often visible to operators and platform teams, and message payloads may contain personal or sensitive data.
What the Consumer Should Do
The consumer side does the reverse.
It extracts trace context from Kafka record headers and uses that context to create a processing span.
Conceptually:
ConsumerRecord<String, byte[]> record = records.iterator().next();

Context extracted = openTelemetry.getPropagators()
    .getTextMapPropagator()
    .extract(Context.current(), record.headers(), KafkaHeaderGetter.INSTANCE);

Span span = tracer.spanBuilder("process payments.requested")
    .setParent(extracted)
    .startSpan();

try (Scope scope = span.makeCurrent()) {
  handle(record);
} catch (Exception e) {
  span.recordException(e);
  throw e;
} finally {
  span.end();
}
Consumer spans often need more operational attributes than producer spans:
- topic
- consumer group
- partition
- offset
- poll batch size
- processing latency
- commit latency
- retry count
- DLQ status
- error type
The OpenTelemetry Kafka semantic conventions provide a useful model for Kafka messaging span attributes. Messaging semantic conventions can change across versions and stability phases, so always check which convention your instrumentation emits.
The important thing is consistency. If one service writes topic, another writes kafka.topic, and another starts putting payload fields into span attributes, trace search and dashboards become difficult very quickly.
Batch, Retry, and DLQ Are Not Trivial
Kafka consumers do not always process one record at a time. A poll usually returns a batch. That creates design choices:
Create one span per record.
Create one span for the whole batch.
Create a batch span and attach record-level events or links.
There is no universal answer.
If each record has expensive processing and downstream calls, record-level spans are useful. If a lightweight consumer processes thousands of records per second, creating one span per record can produce too much trace volume. Sampling, batch spans, and span events may be better.
Retry and DLQ flows are also important.
When a failed record is retried, should the retry span continue the original trace as its parent? Or should it start a new trace and link back to the original?
Immediate retry may fit naturally inside the same trace. But if a message is reprocessed hours later from a DLQ, making the old request the direct parent may be misleading. The trace would suddenly grow a child span long after the original execution ended.
In those cases, span links can express the relationship more accurately: related to the original work, but not part of the same execution timeline.
Standardization Matters More Than the Library
There are many ways to add Kafka tracing.
The OpenTelemetry Java Agent is a fast starting point. If services use standard Kafka clients or Spring Kafka, it can provide useful visibility with little code change. In Kubernetes, the OpenTelemetry Operator can also inject auto-instrumentation.
But larger operations usually need more than auto-instrumentation.
- Some topics contain sensitive payloads and need strict attribute policies.
- Some consumers are better represented as batch spans.
- Some retries should continue the original trace, while some reprocessing flows should use links.
- Business keys may be useful, but raw message keys may be unsafe.
- DLQ reasons may need standardized span events.
At that point, a shared producer/consumer wrapper or interceptor becomes valuable. The goal is not merely “we installed a tracing library.” The goal is “all Kafka-using services follow the same trace context rules.”
Without that standardization, tracing becomes partial very quickly. Some services continue traces. Some break them. Some overwrite headers. Some start new traces during retry. Then, during incident analysis, the trace becomes less trustworthy right when it is needed most.
Metrics and Traces Do Not Replace Each Other
Tracing is very useful in Kafka-based systems. But traces alone cannot explain Kafka operations.
A trace can show that a payment consumer was slow. It may not explain whether the cause was consumer CPU, broker fetch latency, partition imbalance, or storage I/O. Metrics and logs still need to be read together.
This is where a tool like Konduo fits well with tracing. Konduo connects Kafka, JVM, host, container, and alert signals, while tracing shows the path of a request or message. Metrics explain what the system looked like at that time; traces explain where the work traveled. The more Kafka creates asynchronous boundaries, the more important it becomes to interpret those signals together.
A Practical Starting Sequence
If you are adding Kafka tracing for the first time, this order is practical:
- Choose the standard propagation format. Prefer W3C Trace Context unless there is a strong reason not to.
- Verify that
traceparentandtracestateare preserved in Kafka headers. - Define producer send span and consumer processing span names.
- Standardize attributes such as topic, consumer group, partition, and offset.
- Define a security rule that prevents payloads and raw keys from becoming trace attributes.
- Decide when retry, DLQ, and reprocessing should use parent-child relationships versus span links.
- Define sampling behavior.
- Choose the backend later: Jaeger, Tempo, Zipkin, or a vendor APM.
Tool choice matters. But in Kafka tracing, header and context rules come first.
Kafka is an asynchronous boundary. Trace continuity does not happen automatically across that boundary. The producer must inject context, the consumer must extract it, and the organization must apply the same rule repeatedly.
Only then can a trace survive Kafka in the middle.
Further Reading
For related operational and observability topics, these posts connect well with this one:
- Can Kafka Client Metrics Fill the Observability Gap? - Looks at how client-side Kafka signals complement trace visibility.
- JVM Metrics Are Not Enough to Explain a Container - Explains why runtime environment signals matter alongside application telemetry.
- Consumer Lag Is Not a Health Score: Thinking in Kafka Consuming Pressure - Looks at consumer processing through a broader pressure model rather than lag alone.