Engineering Note
Should Metrics Be Pulled or Pushed? Comparing Collection Models
Compare Prometheus-style scraping and OTLP export across convenience, scalability, failure handling, Kubernetes fit, and current hybrid architecture patterns.
There are two broad directions for collecting metrics.
Pull: the collector connects to a target and fetches its metrics.
Push: a target or agent sends metrics to a collector.
Prometheus scraping of /metrics is the representative Pull model. An application or exporter exposes an endpoint, and Prometheus connects to it periodically. An OpenTelemetry SDK exporting metrics to a Collector over OTLP is a representative Push model. Pull means that the target exposes data passively; collection itself is still active work initiated by Prometheus.
Push can sound more modern at first. New services seem able to send data automatically, while a central Collector pool scales horizontally. In Kubernetes, however, a Prometheus setup that discovers Pods through one ServiceMonitor can be much simpler.
Choosing only by asking which model is newer misses the most important operational difference.
This post compares the two models across:
- convenience for developers and platform operators
- scaling as target and data volume grow
- failure handling when a collector or backend becomes unavailable
- deployment in Kubernetes and cloud-native environments
- the current convergence of Prometheus and OpenTelemetry
The short version is that the largest difference between Pull and Push is not the arrow direction.
Who detects collection failure?
Who retries and buffers?
Who decides that a source has disappeared?
The answer determines where the operational responsibility lives.

Separate three layers before comparing
Comparing Prometheus directly with OTLP mixes concepts from different layers. A metrics system is easier to reason about when separated into at least three layers.
Instrumentation: what the application measures
Collection: who opens the connection and moves the data
Storage: which backend stores and queries the time series
Using a Prometheus client library does not require storing everything only in a local Prometheus server. Prometheus can scrape targets and then send the samples to long-term storage with Remote Write.
An OpenTelemetry SDK does not have to send directly to a vendor backend either. It can export OTLP to a Collector, which can translate and send the metrics through Prometheus Remote Write or another backend protocol.
Prometheus now provides an OTLP/HTTP metrics receiver. In the other direction, the OpenTelemetry Collector has a Prometheus receiver that scrapes existing /metrics endpoints. The storage product and the collection direction are separate choices.
The more accurate question is therefore:
At this collection boundary, is Pull or Push a better fit?Comparison at a glance
| Dimension | Pull: Prometheus scrape | Push: OTLP export |
|---|---|---|
| Connection initiator | Collector connects to target | SDK or Agent connects to receiver |
| Initial setup | /metrics endpoint and scrape configuration | SDK or Agent and OTLP endpoint configuration |
| Central control | Collector owns interval, timeout, targets, and sample limits | Collector owns batching, filtering, routing, and retry policies |
| Discovery and identity | Uses discovered targets and labels | Uses a stable receiver plus resource attributes |
| Failure detection | Generates scrape status and the up series | Requires separate exporter-health and missing-data monitoring |
| Backend outage | Usually does not affect the target | Requires queue, retry, drop, and backpressure policies |
| Short-lived work | May finish before a scrape | Can flush before exit, but delivery still needs design |
| Network | Collector must reach every target | Usually needs outbound connectivity from the workload |
| Multiple signals | Focused on metrics | Can carry metrics, traces, and logs through one path |
| Horizontal scale | Target sharding and collector replicas | Receiver and gateway scaling with writer-identity constraints |
| Raw inspection | Easy to open the endpoint directly | Requires inspection across pipeline stages |
Neither column always wins. What is easy for an application developer may also be different from what is easy for a platform team to operate.
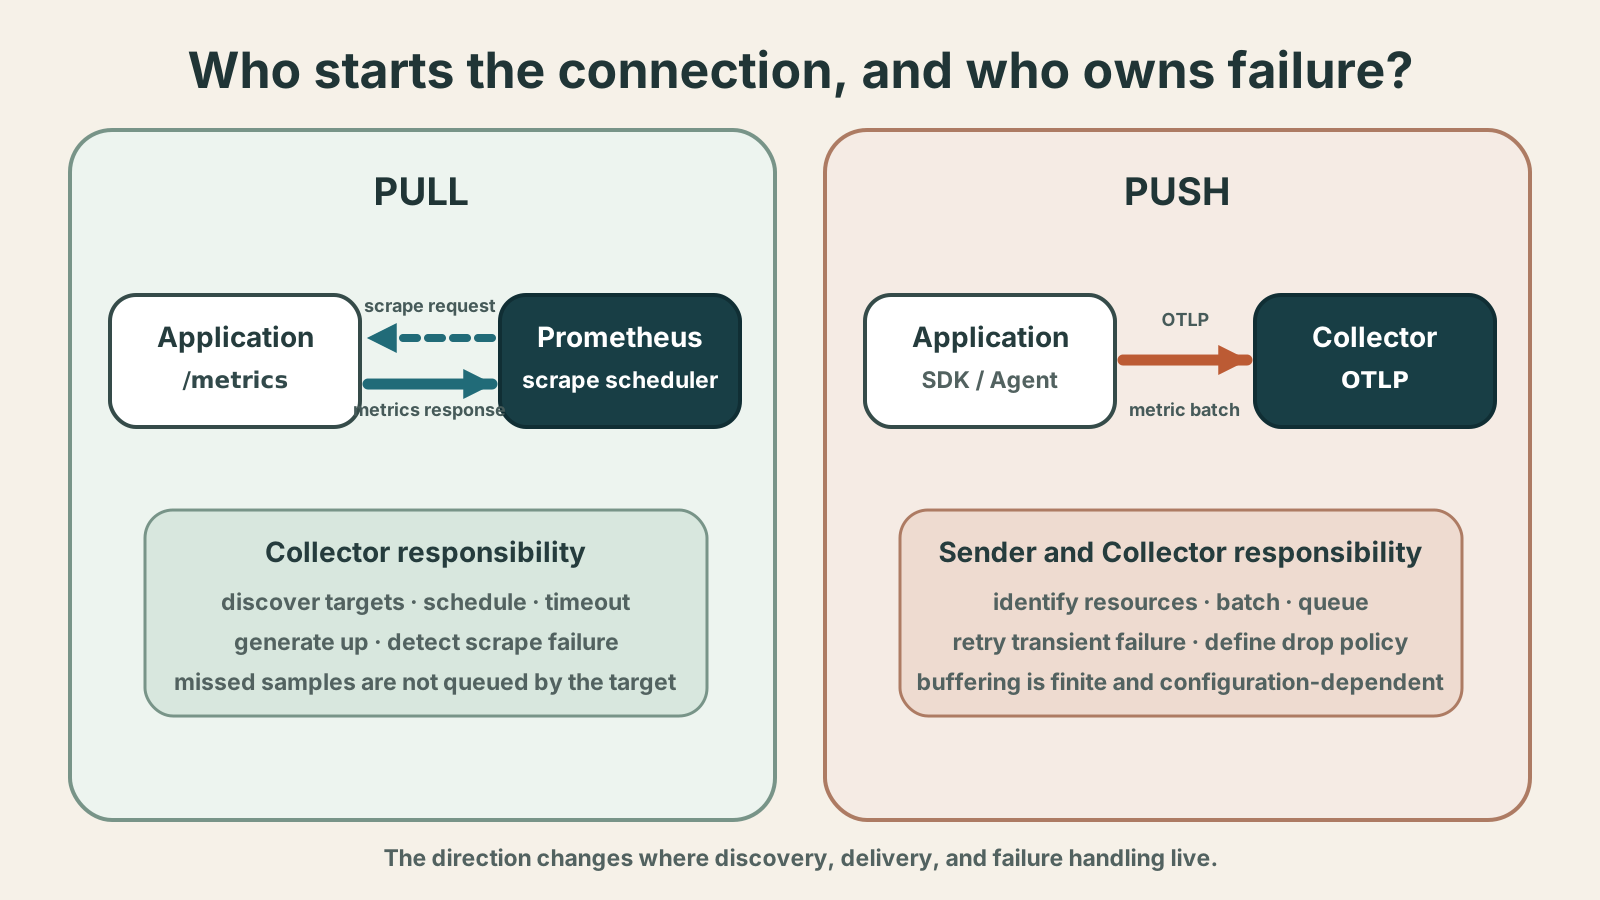
Pull centralizes collection responsibility
An application has a relatively small responsibility in a Pull setup.
Expose the current metric values when requested.Prometheus decides when to collect them, how frequently to retry, and when a scrape has failed. The application does not need the address or credentials of the final storage backend. It must still answer scrapes promptly: expensive calculations or external calls performed while rendering metrics can turn the scrape endpoint into a source of load.
A representative architecture looks like this:
Application / Exporter
        ↑ scrape
Prometheus
        ↓ optional remote write
Long-term Storage
For every scrape, Prometheus attaches job and instance labels and creates series such as up, scrape_duration_seconds, and scrape_samples_scraped. An up value of zero does not prove that the entire business function is down. It means that Prometheus failed to scrape that endpoint successfully. Even with that narrower meaning, collection reachability is available without adding separate instrumentation.
The raw source is also easy to inspect.
curl -s http://application:8080/metricsWhen a dashboard is empty, operators can narrow the issue through the endpoint, service discovery, relabeling, and storage stages.
Pull convenience comes from central configuration
If the collection interval must change from 15 to 30 seconds, or if a label must be dropped, the Prometheus configuration can change without redeploying the application. The collector can also limit unexpected sample counts or response sizes.
This becomes convenient as the number of services grows. Every application does not need to carry a different backend credential, queue policy, and retry configuration.
Prometheus must still be able to reach the target. Central scraping may be awkward for isolated networks, targets behind NAT, agents installed in customer environments, or very short-lived tasks.
Prometheus downtime also does not cause targets to retain historical samples for later collection. Gauge values and short transitions from missed scrape times usually cannot be recovered. If the process remains alive and a cumulative counter does not reset, its total increase can still appear in the next scrape and remain partially visible in a rate calculation. The application remains unaffected by the collector outage, but sample resolution and transient states are lost.
Push moves delivery responsibility toward the sender
In a Push setup, an application SDK or nearby Agent periodically creates a metric batch and sends it to an OTLP receiver.
The simplest topology is:
Application SDK
        ↓ OTLP
Observability Backend
That is useful for development, but it couples the service to a final backend endpoint and authentication mechanism. Production environments usually place a Collector in the path.
Application SDK
        ↓ OTLP
Local Agent / Sidecar Collector
        ↓ OTLP
Gateway Collector
        ↓
One or More Backends
The application hands telemetry to a nearby Collector quickly. Collectors then handle batching, retries, filtering, resource enrichment, and backend routing.
An application can configure an OTLP/HTTP endpoint with environment variables.
export OTEL_EXPORTER_OTLP_PROTOCOL=http/protobuf
export OTEL_EXPORTER_OTLP_ENDPOINT=http://otel-agent:4318
export OTEL_SERVICE_NAME=checkout-api
export OTEL_RESOURCE_ATTRIBUTES=deployment.environment.name=production
A Collector can receive OTLP and forward it to another Collector or backend.
receivers:
  otlp:
    protocols:
      grpc:
        endpoint: 0.0.0.0:4317
      http:
        endpoint: 0.0.0.0:4318

processors:
  memory_limiter:
    check_interval: 1s
    limit_percentage: 75
    spike_limit_percentage: 15
  batch: {}

exporters:
  otlphttp/backend:
    endpoint: https://telemetry.example.com

service:
  pipelines:
    metrics:
      receivers: [otlp]
      processors: [memory_limiter, batch]
      exporters: [otlphttp/backend]
A production setup must also define TLS, authentication headers, queue capacity, and retry behavior. The example only shows the pipeline shape and is not a secure configuration for direct internet exposure.
Push convenience comes from a stable entry point
A Push collector does not need to discover every Pod address. A new Pod can send to the same Collector service. If the external backend changes, the Collector configuration can change without modifying every application.
When traces and logs also use OpenTelemetry, they can share one SDK strategy and Collector pipeline. That is a significant advantage for standardizing application instrumentation.
Discovery does not disappear; part of it becomes identity carried by the sender. If service.name, service.instance.id, or Kubernetes resource attributes are wrong, series from separate Pods can be merged or a restarted instance can appear to be the same writer. A stable receiver address is not sufficient on its own.
The trade-off is responsibility during delivery failure.
How long should retries continue?
What is dropped when the memory queue fills?
Is a persistent queue required?
How long should shutdown wait for a final flush?
Can a Collector outage increase application resource use?
There is no infinitely safe queue. If the backend stays unavailable long enough, the system eventually has to drop data, keep consuming disk, or slow the sender. OTLP exporters can retry transient failures, but the actual buffering window depends on SDK and Collector configuration. Push can absorb some outage periods, but it does not automatically guarantee lossless delivery.
Scalability is fan-out versus fan-in
Pull is a fan-out topology in which a collector opens connections to many targets.
One Prometheus
→ hundreds or thousands of targets
→ periodic scrape per target
As targets grow, service discovery, concurrent connections, scrape response size, and active time series grow together. Once one Prometheus instance reaches its capacity, targets can be divided across shards. Running two Prometheus instances that independently scrape the same targets is also a common high-availability pattern. A global query layer then needs labels or deduplication rules that distinguish the two copies.
Each target remains independent. A slow exporter can usually be isolated to that target within the scrape timeout. Once the target set is sharded, however, global queries and rule evaluation may require a query layer such as Thanos or a central Remote Write backend.
Push is a fan-in topology in which many senders converge on fewer receivers.
Hundreds or thousands of senders
→ Collector gateway pool
→ backend
Scaling receivers behind a load balancer sounds straightforward, but metrics introduce an important constraint. If multiple writers send the same metric stream concurrently, operators may see duplicates, reset interpretation errors, or out-of-order samples. Resource identity such as service.instance.id and the single-writer boundary must remain stable.
If a Collector uses a stateful processor, the platform must also decide whether any gateway can process any batch. Horizontal scaling is not just adding Pods. It also requires deciding where metric identity and processing state live.
Both models are cloud-native in Kubernetes
It is inaccurate to say that Push is always more Kubernetes-native than Pull. Each model aligns with different Kubernetes properties.
Pull and Kubernetes service discovery
With Prometheus Operator, targets can be declared through a ServiceMonitor or PodMonitor. In the example below, the selector chooses a Service labeled app: checkout-api, not Pods directly; the endpoints behind that Service become the scrape targets.
apiVersion: monitoring.coreos.com/v1
kind: ServiceMonitor
metadata:
  name: checkout-api
  labels:
    team: commerce
spec:
  selector:
    matchLabels:
      app: checkout-api
  endpoints:
    - port: metrics
      interval: 15s
      path: /metrics
As Pods appear and disappear, Kubernetes labels and service discovery update the target set. Application Pods do not need a backend address or credential.
This is especially natural for:
- long-running Deployments and StatefulSets
- infrastructure exporters such as node exporter and kube-state-metrics
- systems such as Kafka, Redis, and PostgreSQL with mature exporter ecosystems
- targets where endpoint reachability and collection status matter
Push and Kubernetes Agent/Gateway patterns
The path for applications exporting OTLP fits DaemonSet Agent and Deployment Gateway patterns well.
Each Node: DaemonSet Collector
Each Cluster: Gateway Collector Deployment
Each Region: central ingest or long-term backend
A DaemonSet Collector can receive telemetry from applications on the same node and enrich it with host, kubelet, container, and Kubernetes resource context. It may also Pull data through components such as kubeletstats or the Prometheus receiver. Adopting the Collector does not turn every collection path into Push. A Gateway can own shared policies such as authentication, filtering, and routing.
This model is useful when:
- application metrics, traces, and logs are collected together
- auto-instrumentation is a platform standard
- only outbound connections are allowed from workloads
- multiple clusters or customer environments send to a stable ingest endpoint
- backend changes or multi-backend routing are likely
The Collector itself becomes an operational target. Teams need to monitor its CPU and memory, queue use, refused or dropped telemetry, export failures, and backend latency.
Is Push always the answer for short-lived work?
Short batch jobs and serverless workloads expose a clear Pull limitation. A task that runs for three seconds may finish before a collector using a 15-second interval sees it once.
Push is more natural because the process can flush a final batch before exit. That still does not guarantee delivery. A forced termination or network failure can lose the final data, and a shutdown hook alone does not provide durable delivery semantics. A business-critical job result also needs durable job state or an event record outside the metrics path.
Prometheus Pushgateway is often mentioned in this context, but it should not be treated as a general Push collector for services. It is a narrow tool for preserving the result of service-level batch jobs that cannot be scraped directly. Without explicit lifecycle cleanup, series from completed instances can remain indefinitely, and the up signal available when scraping the original target directly is lost.
The current trend is not Push replacing Pull
OpenTelemetry and OTLP cover a growing part of application instrumentation. They apply common resource identity and transport paths to metrics, traces, and logs while keeping application APIs independent from a specific backend.
That does not make Prometheus scraping obsolete. Kubernetes and infrastructure environments already contain a large ecosystem of /metrics endpoints, exporters, ServiceMonitor resources, and alert rules. Central discovery and scrape-status management remain practical.
The two ecosystems increasingly support each other’s collection paths.
- The OpenTelemetry Collector Prometheus receiver scrapes existing endpoints.
- The OpenTelemetry Operator Target Allocator distributes Prometheus targets across Collectors.
- Prometheus can enable an OTLP/HTTP metrics receiver for pushed metrics. The receiver is disabled by default and needs a deliberate security boundary rather than unauthenticated public exposure.
- Collectors can export OTLP metrics through Prometheus Remote Write.
That makes a hybrid platform architecture natural: scrape infrastructure exporters, receive application telemetry over OTLP, and connect both paths to the same metrics backend and operating context.
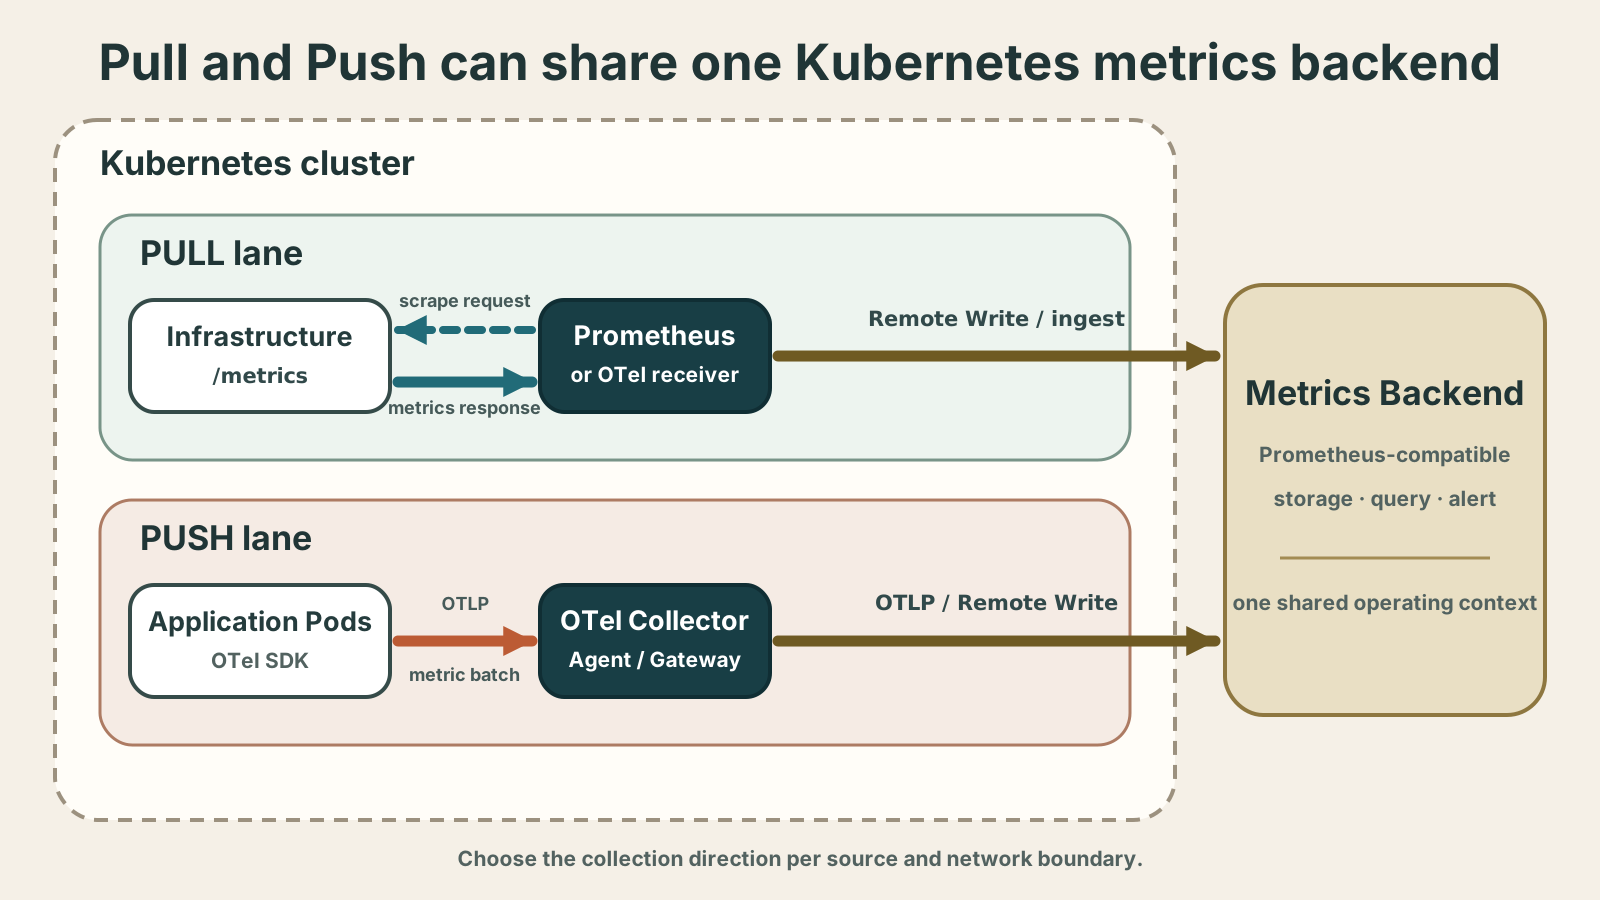
Pull and Push are not global settings that an organization must choose once. They can be selected per source and per network boundary. “Pull for infrastructure and Push for applications” is a useful starting point, not a universal rule.
Selection guide
Consider Pull first when:
- the service or infrastructure target runs continuously
- a proven Prometheus exporter already exists
- endpoint reachability and scrape failure should be visible directly
- collection intervals, timeouts, and label policies belong in a central collector
- applications should not carry backend addresses, credentials, and retry queues
Consider Push first when:
- workloads are short-lived or live behind a boundary that central collectors cannot reach
- collectors cannot reach targets and only outbound traffic is allowed
- metrics, traces, and logs should share one instrumentation system
- filtering, enrichment, routing, and backend changes belong in Collectors
- the platform is prepared to operate export queues and retry policies
Consider a hybrid setup when:
- Kubernetes and infrastructure already use the Prometheus ecosystem
- new applications are being standardized on OpenTelemetry
- existing exporters should connect to an OTLP pipeline without reinstrumentation
- both paths must appear in one backend or operating surface
Operational checklist
[ ] Who initiates the collection connection?
[ ] Does target or sender identity remain correct across restarts?
[ ] Where and for how long is data buffered during an outage?
[ ] What is dropped when a queue fills?
[ ] Can target failure be distinguished from collection-path failure?
[ ] Are duplicate writers and duplicate scrapes prevented or handled intentionally?
[ ] Do collection and export intervals match the detection objective?
[ ] Which layer owns credentials and TLS?
[ ] Are Prometheus and Collectors monitored as first-class services?
[ ] Which layer owns long-term storage and global queries?
Choosing a metrics collection model is not just choosing an endpoint shape. It is deciding where the responsibility for operational failure belongs.
Pull keeps targets simple and makes the central collector responsible for discovery and failure detection. Push crosses network boundaries and unifies telemetry signals more easily, but senders and Collectors must own delivery reliability.
Metric collection is only the beginning. Operators still need to identify which resource produced a signal and interpret it consistently in dashboards and alerts. Konduo connects Prometheus-compatible metric sources with resource plugins so teams can read metrics from targets such as Redis, Kafka, and PostgreSQL in one operating context.
Current architectures divide the boundary instead of insisting on one direction.
Pull for infrastructure and exporters,
Push for application telemetry,
and connect both in one operating context.
References
- Why Prometheus defaults to Pull rather than Push
- Prometheus jobs, instances, and generated scrape series
- Prometheus Operator ServiceMonitor and PodMonitor
- OpenTelemetry Collector Agent deployment pattern
- OpenTelemetry Collector Gateway deployment pattern
- OpenTelemetry Kubernetes Target Allocator
- Using Prometheus as an OpenTelemetry backend
- When to use the Prometheus Pushgateway
Further Reading
- JVM Metrics Cannot Explain a Container - Examines where to collect application-internal and runtime-environment metrics.
- Can Kafka Client Metrics Fill the Observability Gap? - Covers remote client metrics and their operational limitations.
- Run Konduo Community with Docker Compose in 10 Minutes - Shows Prometheus scraping and a Remote Write receiver in a working setup.