Engineering Note
How Much Telemetry Should We Keep? Balancing Collection Cost and Diagnostic Value
Examine metric, log, and trace costs from instrumentation to storage, then use aggregation, sampling, label budgets, and retention policies to preserve useful diagnostic evidence.
Reducing logs and traces can leave the next incident without the records needed to explain it. Storage may be cheaper while investigation time and incident impact increase. Keeping everything is not the answer either: the useful records must be identifiable and connected.
The previous article covered how to narrow down a slow stage in a web application. This article considers how much evidence to collect and retain for that investigation. Start by separating baseline statistics for overall health from detailed records for diagnosis.

1. Locate the cost before reducing storage
The cost of Application Performance Monitoring (APM) and other observability tools goes beyond storage fees. It includes application CPU and memory for producing measurements, network transport, Collector processing, storage and queries, and engineers’ operating time. Running open-source tools yourself still incurs these resource and operating costs.
First identify the largest items in your bills and operational metrics. Volume-based charges, fixed host-based fees, Collector capacity, and query load call for different interventions. Halving data volume does not necessarily halve the total cost.
A trace connects the path and timing of the work performed for a request. A span records an individual operation within it, such as API processing or a database call. Assume a sustained 1,000 requests per second, averaging 10 spans per request and 800 bytes per span. That produces roughly 691GB of raw data per day.
requests_per_second = 1_000
spans_per_request = 10
bytes_per_span = 800
retained_fraction = 0.01

raw_gb_per_day = (
    requests_per_second * spans_per_request * bytes_per_span * 86_400 / 1_000_000_000
)
print(f"Raw: {raw_gb_per_day:.2f} GB/day")
print(f"Retained estimate: {raw_gb_per_day * retained_fraction:.2f} GB/day")
Randomly selecting 1% of requests gives an estimated retained volume of 6.9GB/day if the sample has the same average data size as the full population. This is a sizing example, excluding compression, indexes, replication, transport overhead, and billing rules. It is not a recommended sampling rate. Favoring requests with more spans, such as some slow requests, also changes the relationship between the fraction of traces and the fraction of bytes retained.
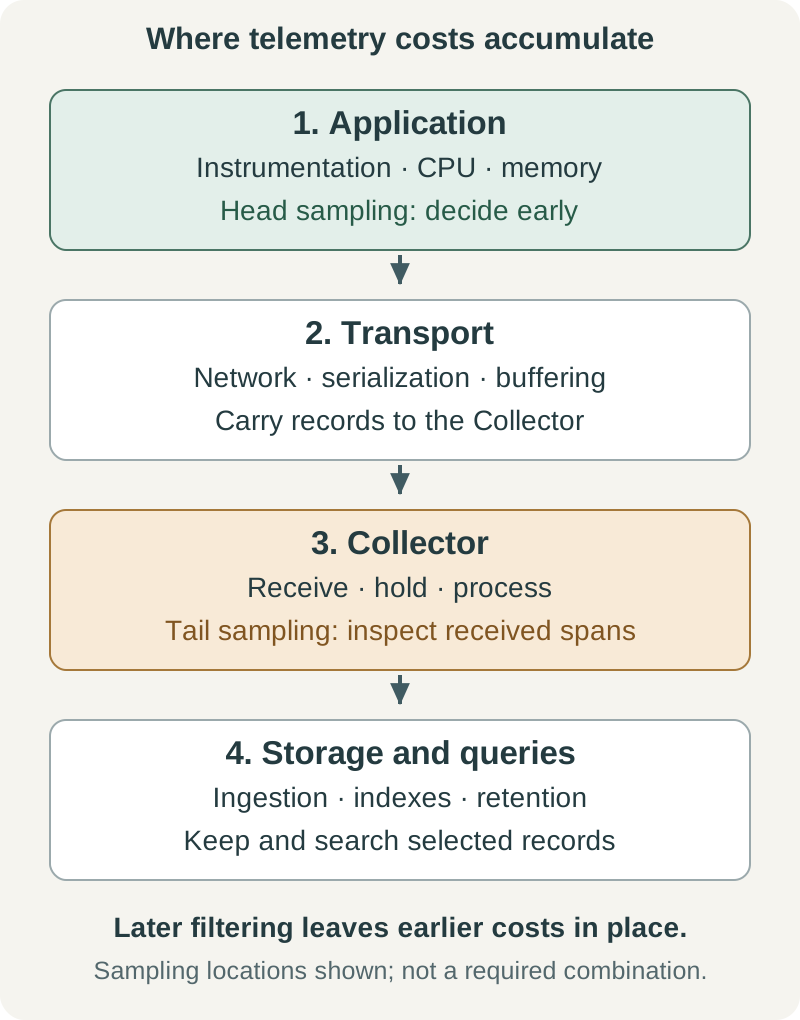
If all the data reaches the Collector before 99% is discarded, the upstream generation and transport work remains. Distinguish calculated storage volume from the costs an intervention actually removes.
You can also make transport more efficient while retaining the records selected for export. Batching groups records to reduce calls and per-transfer overhead; compression reduces transmitted bytes. Neither summarizes observations as aggregation does. Account for batching delays, buffer memory, and compression CPU. If billing uses uncompressed volume or event counts, lower network volume may not translate directly into lower charges. OpenTelemetry batch processing
2. Aggregate baseline statistics and select detailed records
Metrics narrow the overall picture through request counts, errors, and latency distributions. Logs explain particular events; traces show the path and timing within requests. They do not all need the same reduction policy. Real User Monitoring (RUM), which observes experience in users’ browsers, also needs its own coverage policy.
| Collection target | Baseline evidence | Scope to expand during investigation |
|---|---|---|
| Service metrics | Counts, errors, and latency distributions covering all requests | Wait and resource saturation signals on suspected paths |
| RUM | Baseline statistics for sampled sessions; detail for slow or failed actions | Samples for affected devices, releases, or screens |
| Traces | Random samples and records of important business paths | Slow requests, errors, and new releases |
| Logs | Structured events with request correlation | Detailed logs for selected services and time windows |
Aggregation summarizes multiple observations as counts, sums, or distributions. Unlike sampling, which selects only some requests, aggregation can include every request in the statistics while reducing the storage needed for individual records. For example, instead of storing 1,000 separate response times, retain request counts, error counts, response-time sums, and histograms by route. Histograms group response times into ranges to preserve a distribution.
Decide which distinctions must survive aggregation. Combining instance-level metrics into service-level metrics can reduce the number of time series, but the aggregate no longer identifies a single slow instance. Summary statistics also cannot reconstruct individual request sequences or causes, so retain useful log and trace samples alongside them. OpenTelemetry metrics data model
The cost benefit depends on where aggregation happens. Sending only application-side aggregates can reduce transport compared with sending individual records. Aggregating at the Collector leaves upstream transport costs in place. Aggregating only at query time, or storing both raw data and aggregates, does not reduce the collection or storage volume of the raw data.
Protect metrics used for alerts and Service Level Objectives (SLOs). Filtering the total-request denominator or counts of failures and slow requests can make a metric improve without changing the service. Check that alert conditions and the population being aggregated remain valid after a cost-policy change. Service level objectives
Traffic share alone does not determine importance. A settlement job running only a few times a day can disappear from a 1% random sample of all requests. Give such paths explicit coverage and verify that records of both success and failure actually survive.
3. When you select traces changes which costs you reduce
Sampling selects a subset of the full population. Head sampling decides when a trace starts, making it useful for reducing detailed span generation and transport. Final latency and errors are not yet known.
Tail sampling collects arriving spans and decides what to retain based on latency, errors, or other attributes. It helps select problem requests but requires Collector capacity to receive and hold records before deciding. It cannot recover traces discarded by head sampling. OpenTelemetry sampling
Consider head sampling when instrumentation and transport overhead are high, and tail sampling when selection requires the final outcome. When combining them, account for the fact that downstream selection cannot recover records excluded upstream.
Tail sampling requires a trace’s spans to reach the same decision point. Late spans, decision windows, and memory limits can leave incomplete records. A policy to retain errors does not guarantee that every error record arrives. Tail sampling processor
A collection favoring errors and slow requests is deliberately biased. Its average or p99 does not describe the entire service. Here, p99 is the boundary at or below which 99% of observations fall. Aggregate overall service-health metrics independently of this retention policy.
4. Control RUM coverage separately from detailed reporting
RUM can use JavaScript included in the service to measure activity in actual users’ browsers and report results. Users do not need to open developer tools or press a measurement button.
For example, randomly select 5% of sessions, retain baseline statistics including normal actions, and send detail only for slow or failed actions. The 5% rate is illustrative. Session selection controls measurement coverage; detailed-reporting conditions control the volume sent and stored. Check actual sample counts by screen and device, not just the percentage. Small samples can miss rare errors or make latency comparisons unstable.
If every browser downloads and initializes the measurement library before selection, the initial loading cost remains. Selected browsers still need measurement and temporary buffering to evaluate thresholds. Check browser CPU, memory, and loading impact alongside reporting volume.
Slow actions can multiply during an incident, causing detailed reporting to surge. Cap event sizes, event counts, and browser buffers, and count the details omitted by those limits. Separate limits for baseline statistics and detailed records reduce the risk that a surge of detail crowds out the baseline.
When increasing coverage for a specific device or release, record the selection conditions, rates, and effective period. Do not merge observations with different selection probabilities and treat them as the overall user distribution without adjustment. Preserve a comparable baseline across policy changes.
5. Filter unnecessary records and fields, and manage labels
Filtering excludes records or fields according to defined conditions. Review detailed successful health-check logs, unused attributes, and duplicate collection first, while preserving necessary availability metrics and errors. Define coverage at the source: retain only necessary request-body fields and exclude authentication tokens from records. Collector-side filtering is also possible but leaves upstream costs in place. OpenTelemetry filtering and attribute processing
Before lowering log levels across the board, identify repeated content. If the same error occurs tens of thousands of times, consider counting every occurrence in a metric while retaining only some detailed logs. Record omitted counts so that retained log counts are not mistaken for actual error counts.
Keep timestamps, service and release, operation path, outcome or error category, and request or trace IDs for correlation. Check whether those fields support diagnosis before capturing full request and response bodies. Records that cannot tolerate omissions, such as required audit or transaction records, need policies separate from diagnostic logging.
For metrics, cardinality is the number of distinct label combinations. Labels identify dimensions such as routes or regions. A time series is a sequence of measurements sharing the same metric name and label combination. In a hypothetical request counter, 20 routes, three regions, and five outcome categories produce 300 time series if every combination occurs. Adding a unique request ID creates new combinations as requests arrive. Other labels, including instances, also affect the actual count.
Normalize routes, for example route="/orders/{id}", and keep unbounded values such as user IDs, request IDs, and full URLs out of metric labels. Keep necessary identifiers in logs or traces, while also checking retention and search-index costs there. Prometheus label guidance
6. Design retention and search speed together
Different data can have different retention periods. Detailed records support individual investigations; long-term statistics support release comparisons and weekly or monthly trends. But simply declaring that detail should expire quickly can leave a problem discovered after a weekend without usable records.
Review the delay between recent incidents occurring, being detected, and investigation beginning. Use that delay and the time needed for follow-up to set baseline retention. Preserve evidence needed by an active investigation before it expires. Apply separate requirements to records retained for purposes such as auditing.
Storage tiering is a separate choice from retention duration. Keep frequently queried recent data in fast storage and rarely accessed older records in a cheaper tier. Depending on the product, searches may slow down or require restoration. Include retrieval and query costs and the delay before investigation can begin, not just storage fees. Elastic data-tier example
Review indexing scope and repeated queries too. Index fields needed for investigation, and adjust dashboard time ranges, refresh intervals, and repeated calculations. Fewer indexes can slow searches, while stored precomputed results add storage. Compare costs and response times using the incident-investigation queries actually run most often.
Time aggregation can also support long-term retention. For example, keep recent data at ten-second resolution and summarize older data into five-minute windows. These intervals are illustrative; the timing of brief latency spikes becomes less precise.
Averaging p99 values does not produce a five-minute p99. Calculate the mean from response-time sums and counts for that window, and estimate percentiles from merged compatible histograms. Check bucket boundaries, resolution, and aggregation compatibility. Prometheus histograms and summaries
Adding successive cumulative counter readings can count the same requests repeatedly. First derive the increase within the window for each time series, accounting for resets after restarts, then aggregate. In Prometheus, apply rate() or increase() to each series before aggregating. Current-state values such as CPU utilization are not counters and need different treatment. Prometheus counter aggregation order
Shorter retention can reduce storage requirements without changing daily ingestion or instrumentation overhead. Increasing metric collection intervals reduces the number of collected observations, but can obscure short-lived changes. Evaluate the cost being reduced alongside the temporal resolution being lost.
7. Verify that the same problem remains diagnosable
Validate a new policy on selected services or a fraction of traffic before applying it everywhere. Consider a hypothetical investigation of a slow order-list screen. The new policy should preserve the evidence needed to answer these questions:
- Can baseline statistics identify the affected time, release, and devices?
- Can a slow action be connected to the relevant request logs and traces?
- Can the slow operation be compared with normal requests?
If browsers and servers select samples independently, a recorded slow browser action may have no retained server trace. A correlation ID alone does not ensure that both records survive. Coordinate selection and retention for important paths, and check how often the resulting records can actually be connected.
Applying new filters to existing records helps evaluate what would remain in storage. It does not reproduce browser or application instrumentation overhead, Collector buffer pressure, or actual transport loss, so validate those during a limited operational rollout as well.
Deliberately retaining less and losing data under overload are different outcomes. Track Collector queue use, rejected and discarded records, failed sends, and permanent loss. Do not count every transient send failure as permanent loss when retries succeed. Full queues and exhausted retry limits can lose records independently of sampling policy. OpenTelemetry Collector resiliency
Record five things in the policy:
- The questions each signal should answer and the correlation fields it needs
- Baseline coverage, sample rates, aggregation granularity, and the information lost
- Limits for series count, daily ingestion, retention, Collector resources, and query and retrieval costs
- The scope, expiration, and automatic reversion of temporary collection increases
- Cost changes, the fraction of required records found, and time to narrow the cause
Assign an owner and a review date to each policy. Traffic and service changes can make the original limits unsuitable.
An appropriate observability budget cannot be reduced to a single sampling rate. Preserve the evidence needed to investigate important problems, then reduce repetitive or unused detail. Evaluate collection policy by both the costs saved and the ability to explain the next incident.
Further Reading
- Where Is the Web Application Slow? A Guide to Narrowing the Problem — Use telemetry to narrow the scope of a real performance problem.
- Should Metrics Be Pulled or Pushed? Comparing Collection Models — Examine collection failures, buffering, and operational responsibilities.