Engineering Note
What a Safe Strimzi Extension Must Preserve
Using the Pletor Kafka image as an example, learn how to add node-metrics-agent without breaking Strimzi's launcher, lifecycle, or JMX Exporter contracts.
Building a custom image for Strimzi should not mean reimplementing the Operator. Strimzi owns the difficult parts of running Kafka on Kubernetes: listeners, certificates, Secrets, storage, and rolling updates. A safe extension preserves that boundary and adds only the capability that belongs with the workload.
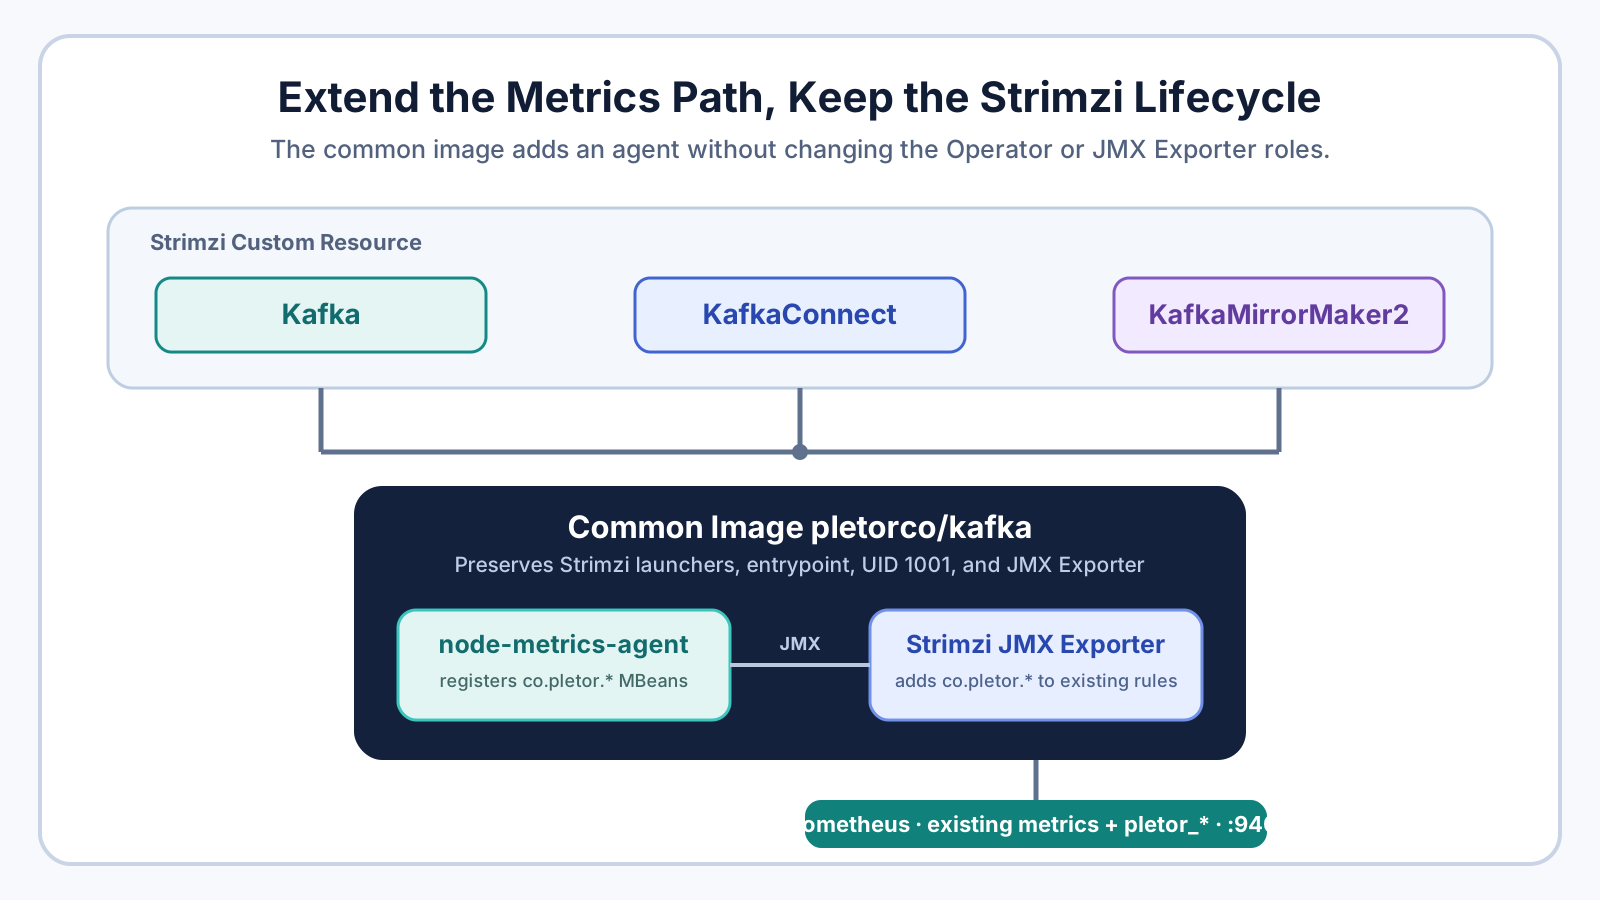
This article uses pletorco/kafka as a concrete example. It starts from a digest-pinned official Strimzi operand image and adds only Pletor node-metrics-agent. It does not replace Strimzi’s entrypoint, Kafka/Connect/MM2 launchers, or bundled Prometheus JMX Exporter.
The point is not to introduce one image. It is to establish criteria for a safe extension: which capability belongs inside the JVM, which responsibilities remain with Strimzi, and how the added layer can be audited. node-metrics-agent is the example that puts those criteria into practice.
Three Boundaries That Preserve Compatibility
This image is neither a Kafka distribution nor another Operator. It adds a thin observability layer to an operand image that Strimzi already understands. Keeping the following boundaries intact extends the workload without changing the Operator’s model.
| Responsibility | Owner | What the image does |
|---|---|---|
| Pod creation, configuration, and updates | Strimzi Operator and CR | Leaves it alone. Strimzi still owns listeners, KRaft, Secrets, certificates, storage, and rolling updates. |
| Collecting metrics inside the container | node-metrics-agent | Attaches to the same JVM and registers process, cgroup, filesystem, and related signals as co.pletor.* JMX MBeans. |
| Prometheus exposure | The JMX Exporter in the Strimzi base image | Uses rules from the existing metricsConfig ConfigMap to turn those MBeans into pletor_* metrics. |
node-metrics-agent does not open an HTTP endpoint of its own. That is intentional. It registers JMX MBeans; the JMX Exporter already bundled by Strimzi continues to own the Prometheus endpoint. There is no second JMX Exporter JAR and no agent-specific port to expose.
The existing Kafka or Connect metrics are not replaced by a separate metric stream. The configuration adds rules for co.pletor.* MBeans to the exporter that already converts the workload’s JMX MBeans. One metricsConfig and one :9404 endpoint therefore expose both the existing kafka_* or connect_* families and the new pletor_* families.
Why a Sidecar Does Not Provide the Same Metrics by Default
A sidecar is useful for many deployment concerns, but it does not fit this collection goal. node-metrics-agent needs the runtime environment of the same JVM and container that run Kafka. If the goal is to accurately collect Kafka container JVM, cgroup, process, and filesystem metrics, a conventional sidecar alone cannot do it. Its co.pletor.* MBeans must also be registered in that JVM for the existing JMX Exporter to read them directly.
A sidecar can share a Pod’s network, but it does not automatically see the Kafka container’s processes, /proc/self, file-descriptor limits, or filesystem as its own. Reading its own cgroup measures the collector’s CPU and memory limits and usage, rather than Kafka’s. It is possible to interpret a Pod-level cgroup or a host cgroup hierarchy separately, but that is not a simple, portable way to get container-level Kafka values.
Volumes have a narrower exception. If the Kafka PVC is mounted into the sidecar as the same volume, the sidecar can read the capacity and free space of that shared volume. It still cannot see the Kafka container’s image filesystem or paths that are not mounted into the sidecar, and the additional mount and permissions require review. Reading Kafka JVM MBeans would additionally require exposing and securing remote JMX, or separately designing the process namespace, paths, and restart ordering.
Combining remote JMX, a host-level collector, or a shared process namespace with cgroup access can work around parts of that boundary. But that is no longer collection by a conventional sidecar alone; it adds permissions, connection points, and collection paths to a Pod managed by Strimzi.
There is a more direct operational issue: Strimzi does not provide a general CR extension point that manages arbitrary sidecars as part of one resource. Its template customizes Pod metadata, security, and volumes, along with selected settings of the Kafka or Connect container that Strimzi creates. It is not a general PodSpec for declaring an arbitrary extra container list. Direct edits to an Operator-managed Pod are reverted during reconciliation. An admission webhook can inject a sidecar, or another controller can manage one, but then mounts, resources, security policy, and rolling-update compatibility for Kafka, Connect, and MM2 must remain managed outside Strimzi.
A Java agent instead attaches once to the JVM Strimzi already starts and reuses the standard image property, the existing metricsConfig, and the :9404 endpoint. The CR can specify the image and reference the ConfigMap, which is why this image uses an agent rather than a sidecar for these signals.
Do Not Choose the Launcher
Strimzi’s Kafka, KafkaConnect, and KafkaMirrorMaker2 resources share the Kafka operand image family, but select a different launcher for each workload. A common image should not try to choose a launcher or emulate Kafka Connect; doing so is an easy way to break the compatibility contract.
pletorco/kafka deliberately avoids that role. It preserves the launchers and runtime scripts from the official image, and adds one Java agent through KAFKA_OPTS.
KAFKA_OPTS=-javaagent:/opt/pletor/agents/node-metrics-agent-0.8.0-all.jar=/opt/pletor/config/node-metrics.ymlWhichever JVM Strimzi starts, the agent attaches in the same way. A Kafka broker registers signals from its own runtime environment; Kafka Connect and MirrorMaker 2 register signals from the Connect worker environment. MirrorMaker 2 runs on the Connect runtime, so it uses the Connect JMX rules.
The image adds only these files:
/opt/pletor/agents/node-metrics-agent-<version>-all.jar
/opt/pletor/config/node-metrics.yml
/opt/pletor/share/node-metrics/{kafka,connect,mm2}.yml
/opt/pletor/share/jmx/{kafka,connect,mm2}.yml
The Added Layer Must Be Auditable
An image like this should make its additions inspectable. The public Dockerfile shows the files and JVM options placed on top of the Strimzi base image, and the public node-metrics-agent source makes its MBean registration and behavior reviewable. In production, compare the exact image manifest digest with the agent JAR SHA-256, SBOM, provenance, and signature to connect the declared layer to the deployed artifact.
That process does not prove the absolute absence of every defect or malicious behavior. It does make the added components and the origin of their dependencies independently auditable.
It deliberately keeps the base-image launcher, entrypoint, UID 1001, and JMX Exporter. Strimzi documents image properties for using a compatible custom image, while warning that an incompatible image might not work. Preserving the upstream runtime contract is therefore the first requirement for this type of extension. See Strimzi’s image configuration reference.
Do Not Split the Existing Metrics Path
The agent does more than add JVM-internal metrics. It registers container-visible CPU, memory, cgroup memory, filesystem, I/O, file-descriptor, and agent health signals as JMX MBeans. The node-metrics-agent repository lists the MBeans and its fail-open behavior in detail.
Strimzi’s metricsConfig points the JMX Exporter to a ConfigMap. Add the co.pletor.* object names and rules alongside the existing Kafka or Connect rules, and the exporter exposes the existing workload metrics and pletor_* metrics together on port 9404. The current Strimzi documentation notes that Prometheus metrics are not enabled without metricsConfig, and that a resource selects either Prometheus JMX Exporter or Strimzi Metrics Reporter. See the metricsConfig reference.
The following is the addition for a Kafka metrics ConfigMap. It is not a complete configuration file by itself: retain the existing Kafka JMX rules and merge these object names and rules into the same ConfigMap.
includeObjectNames:
  - kafka.*:*
  - co.pletor.cgroup:*
  - co.pletor.node:*
  - co.pletor.proc:*
  - co.pletor.agent:*

rules:
  - pattern: 'co.pletor.cgroup<type=(.+?)(?:,(.+))?><>(.+):'
    name: pletor_cgroup_$1_$3
    type: GAUGE
    cache: true
  - pattern: 'co.pletor.node<type=FsMetrics, path=(.+)><>(.+):'
    name: pletor_node_fsmetrics_$2
    labels:
      path: '$1'
    type: GAUGE
    cache: true
  - pattern: 'co.pletor.node<type=(.+?)(?:,(.+))?><>(.+):'
    name: pletor_node_$1_$3
    type: GAUGE
    cache: true
  - pattern: 'co.pletor.proc<type=(.+?)(?:,(.+))?><>(.+):'
    name: pletor_proc_$1_$3
    type: GAUGE
    cache: true
  - pattern: 'co.pletor.agent<type=(.+?)(?:,(.+))?><>(.+):'
    name: pletor_agent_$1_$3
    type: GAUGE
    cache: true
Kafka Connect and MirrorMaker 2 retain their Connect rules and add the same co.pletor.* section. Files under /opt/pletor/share/jmx/ are reviewable starting points; they do not create or overwrite the ConfigMap managed by the Operator. That separation keeps metric names and labels under GitOps control while the same image can be reused across clusters.
Specify the Image and Configuration References in the CR
In a Kafka CR, use an exact tag that matches both the installed Strimzi release and the Kafka version. Do not use a mutable tag such as latest. This is not a complete Kafka CR; it only shows where to specify the image and metrics settings in an existing resource. Before applying it, check the published pletorco/kafka tags against the versions supported by your installed Strimzi Operator.
apiVersion: kafka.strimzi.io/v1
kind: Kafka
metadata:
  name: orders
spec:
  kafka:
    version: 4.3.0
    image: pletorco/kafka:1.1.0-kafka-4.3.0-pletor.1
    metricsConfig:
      type: jmxPrometheusExporter
      valueFrom:
        configMapKeyRef:
          name: orders-kafka-metrics
          key: metrics-config.yml
Tags use this shape:
<strimzi-version>-kafka-<kafka-version>-pletor.<image-release>The tag identifies the Strimzi compatibility line, Kafka version, and the Pletor image-layer revision. The image release process selects only Kafka versions marked supported: true by the selected Strimzi release, then publishes linux/amd64 and linux/arm64 manifests. In production, pin the manifest digest as well as the tag.
Kafka Connect and MirrorMaker 2 use the same image tag through spec.image. Keep one image across the three CRs, but point Kafka to Kafka rules and Connect/MM2 to Connect rules.
The Scope of the Default Filesystem Configuration
The common image watches only / in its default node-metrics.yml. That is the most portable default for an image that cannot know which volumes will hold Kafka logs, Connect plugins, or application logs.
The image also contains workload reference configurations, such as /var/lib/kafka for Kafka and /tmp for Connect. They are not automatically selected, however: the Java agent in the current public image has a fixed configuration argument of /opt/pletor/config/node-metrics.yml.
# Kafka reference configuration
fsmetrics_max_partitions: 32
fsmetrics_paths:
  - /var/lib/kafka
This is a current limitation to understand before rollout. Strimzi supports additional volume mounts only below /mnt, so do not try to replace /opt/pletor/config/node-metrics.yml through a CR template. KAFKA_* variables are also internal Strimzi variables and cannot be overridden from a CR. To observe a specific data volume precisely, use a compatible derived image that contains the required configuration, or improve the image to select configuration from a /mnt path before applying it.
In every case, choose paths from the actual Pod volume mounts and container paths. This image does not inspect an entire Kubernetes node’s disk or another Pod’s filesystem; it reports the runtime environment visible to its JVM. node_exporter, kubelet, or cAdvisor metrics can still be necessary for node-wide visibility.
Verify Metrics, Not Just an Open Port
An open JMX Exporter port does not prove that the agent is connected. Check for actual pletor_* metrics after rollout.
First, run port forwarding in one terminal.
pod="$(kubectl get pod \
  -l strimzi.io/cluster=orders \
  -o jsonpath='{.items[0].metadata.name}')"

kubectl port-forward "pod/$pod" 9404:9404
Keep port forwarding running and use a second terminal for the metric check.
curl -fsS http://127.0.0.1:9404/metrics \
  | grep -E '^pletor_(node|cgroup|proc|agent)'
Then confirm all of the following:
- Strimzi reconciliation and Pod readiness succeed.
- Each Kafka, Connect, or MM2 JVM attaches the agent once.
- Existing listeners, Secrets, CAs, storage, and connector settings remain intact.
- Kafka and Connect/MM2 metrics ConfigMaps use their appropriate rules.
- The metrics endpoint actually exposes
pletor_*signals.
The image is built from a digest-pinned Strimzi base image and an agent artifact verified with SHA-256. CI also checks the Kafka and Connect launchers, MM2 plugin, base JMX Exporter, UID, and duplicate agent attachment. Static checks do not prove volume mounts, permissions, or Prometheus scraping in a real cluster, so the final check belongs in a Strimzi environment close to production.
Responsibilities That Stay with Strimzi
Adding observability does not take over Strimzi’s other responsibilities.
- Strimzi still manages listeners, KRaft node pools, authentication and authorization, Secrets, CAs, and certificates.
- Customer configuration and credentials, connector plugins, and VM installation tooling are not baked into the image.
node-metrics-agentdoes not expose an independent HTTP endpoint. Prometheus needsmetricsConfigand JMX Exporter rules.- Container-visible signals are not the same as the state of an entire Kubernetes node.
When Kafka Connect needs connector plugins, use KafkaConnect.spec.build.plugins or an approved derived image. The Pletor common image provides an observability base; it is not meant to accumulate every runtime extension.
Kafka operations rarely become clear from broker metrics alone. JVM, cgroup, filesystem, and I/O signals help narrow down storage pressure and runtime constraints. Konduo connects operating targets such as Kafka through plugins so teams can follow status, metric evidence, and alert response in one flow. In a Strimzi environment, those signals are most useful when interpreted with the CR, Pod, and actual storage path that produced them.
Closing Thought: A Safe Extension Preserves the Contract
A Strimzi-compatible image is not an image that replaces the Operator. A good one preserves the upstream launcher and lifecycle while adding only the capability that belongs in the JVM.
Use these four questions when reviewing an extension image:
- Does it preserve startup and lifecycle? It must not alter Strimzi’s launchers, runtime user, or shutdown and restart flow.
- Does it leave Operator responsibilities with Strimzi? The image should not take over listeners, certificates, Secrets, or rolling updates.
- Does it extend the existing observability path? Exposing a new signal through the existing JMX Exporter and
metricsConfigis easier to operate than creating another collection path. - Can teams trace the added layer? They need to be able to inspect the base-image digest, added artifact version and checksum, and the published source and build information.
pletorco/kafka follows that rule for node-metrics-agent. The agent registers MBeans, the existing JMX Exporter exposes them to Prometheus, and Strimzi continues to manage Pods and Kafka lifecycle. By not replacing launchers, creating a separate metrics path, or hiding the added layer, it extends observability across Kafka, Connect, and MirrorMaker 2 without changing the operating model.
Further Reading
- JVM Metrics Alone Cannot Explain a Container — A closer look at the signals and JMX MBeans collected by node-metrics-agent.
- Kafka Partitions Look Fine, but the Disk Is Full — Why Kafka metrics alone are not enough to judge storage pressure.
- Can Kafka Client Metrics Close the Observability Gap? — The collection boundaries and remaining gaps in Kafka telemetry.